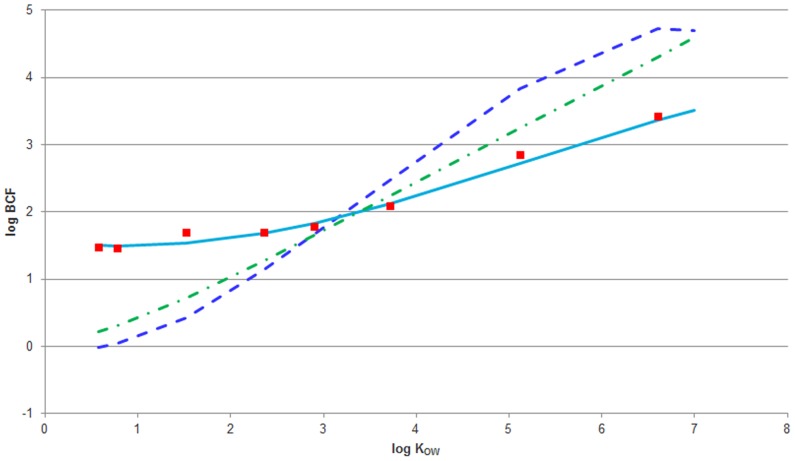
Figure 4. Comparison between measured and modeled bioconcentration factors (log BCF) in fish and fish cells.
Average BCF measured in cells (red ▪), kinetic BCF calculated from our empirical model for rate constants (light blue —), equation: log BCF = −0.0078·(log KOW)3 +0.1236·(log KOW)2 −0.2073·log KOW+1.5872, predicted BCF in fish by the Arnot & Gobas model [38] (dark blue - -) and BCF predicted in rainbow trout by the PBTK model (green - •); model parameters: fish weight - 2 g, lipid fraction - 5%, water fraction - 75%). For propiconazole (log KOW = 3.72) and pentachlorophenol (log KOW = 5.12), steady-state condition was not reached within 24 hours.

