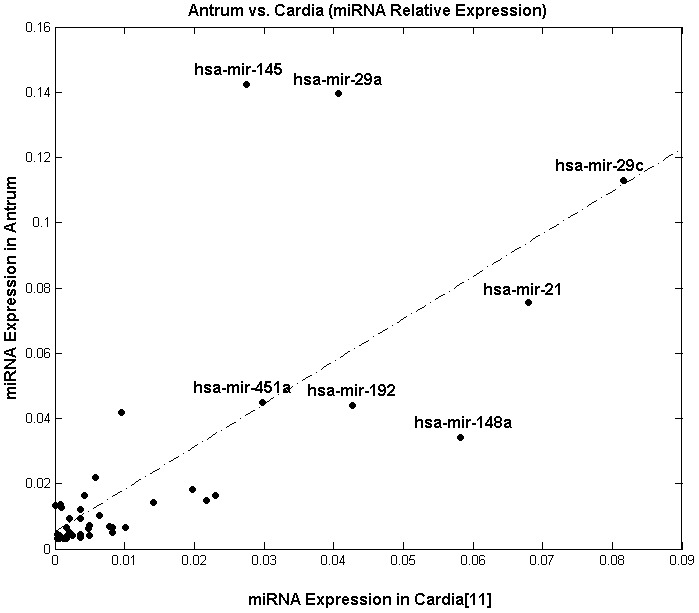
Figure 3. Correlation between the relative expression profiles of the antrum and cardia [11].

For this analysis, all of the miRNAs with at least 10 reads in the antrum were used. The Pearson’s correlation value indicates that the expression profiles of the antrum and cardia tissues are significantly correlated (r = 0.73; p-value < 0.001).
