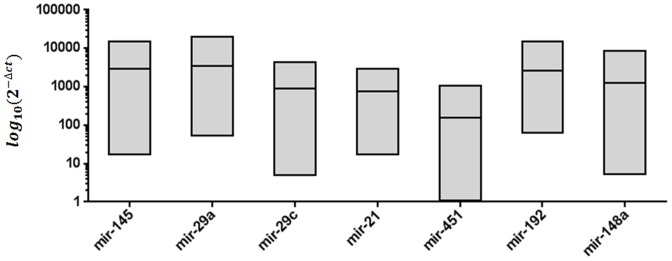
Figure 5. Quantification of the highly expressed miRNAs in the human gastric antrum region mucosa using RT-PCR.

Quantification was based on Ct values and normalized using an endogenous Z30 expression control. The 2(−Δct) for each miRNA is the mean of ten replicates of gastric antrum tissue from ten different individuals.
