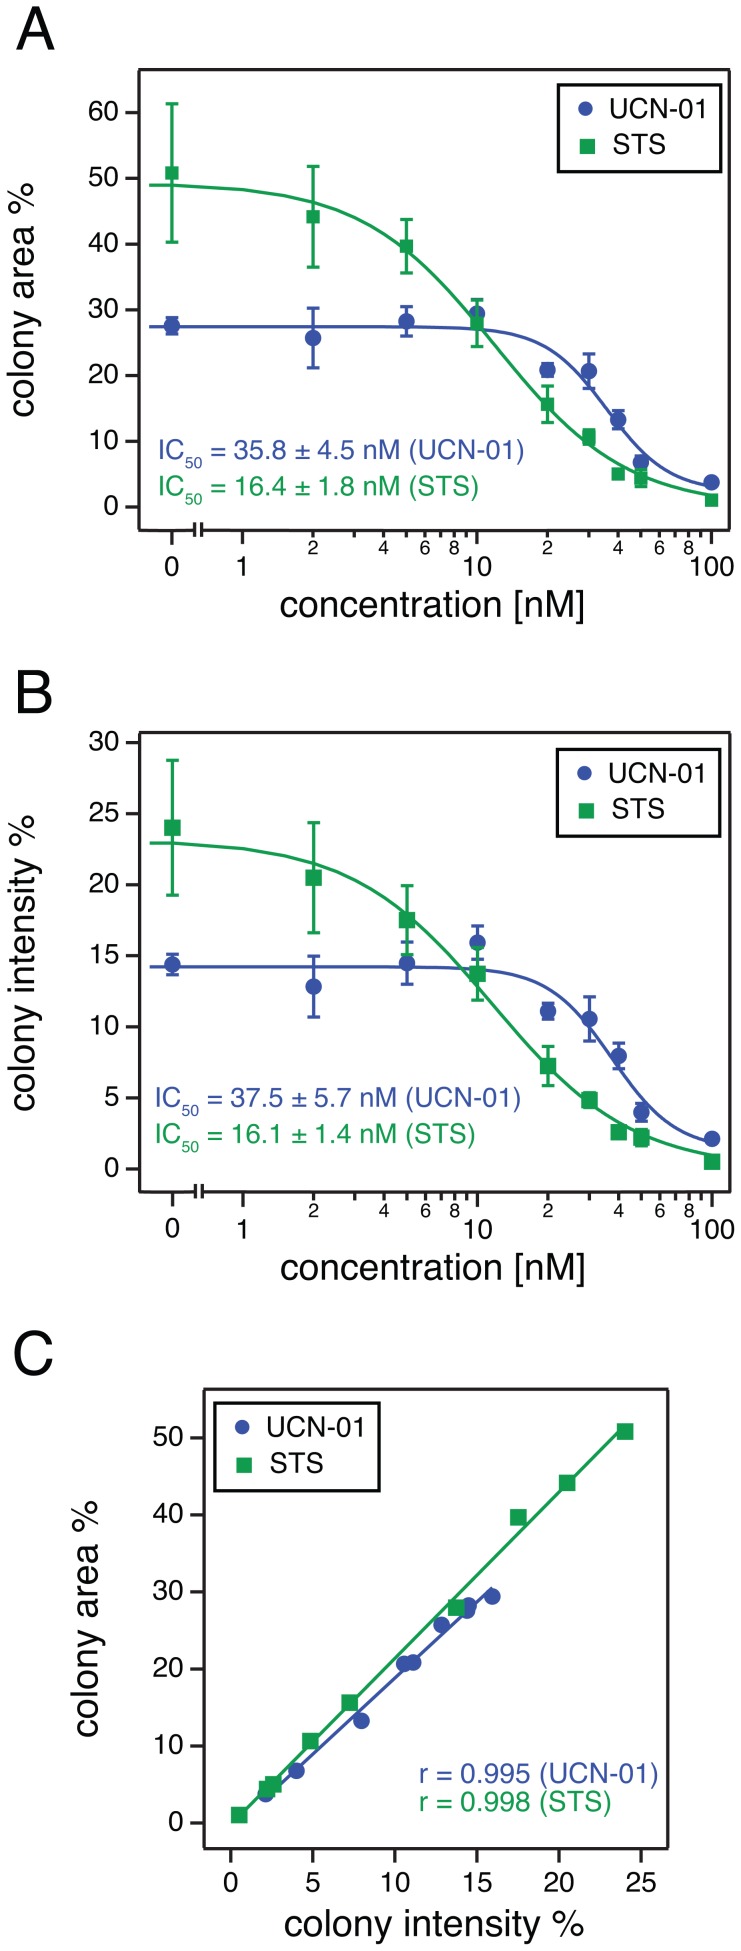
Figure 5. Quantification of T98G glioma cell growth after treatment with UCN-01 or staurosporine using the ColonyArea.
Colony formation of T98G human glioma cells was studied after treatment with increasing concentrations of the staurosporine derivative UCN-01 or staurosporine (STS). Image data were analyzed using ColonyArea. Its output parameters were then used to generate dose response curves and determine the half maximal inhibitory concentrations (IC50) of the compounds. (A) Examples of dose response curves using the colony area percentage; IC50 = 35.8±4.5 nM (UCN-01) and IC50 = 16.4±1.8 nM (STS). (B) Examples of dose response curves using the colony intensity percentage; IC50 = 37.5±5.7 nM (UCN-01) and IC50 = 16.1±1.4 nM (STS). Dots correspond to averages and error bars to the standard deviations of measurements from four wells. Curves were fitted using equation (3 ). Additional independent experimental repeats can be found in Figures S1, S2, S3, S4. (C) Correlation analysis of results obtained using the colony area percentage and results obtained using the colony intensity percentage. Regression lines are drawn and the Pearson product moment correlation coefficients ‘r’ is displayed for each data set.

