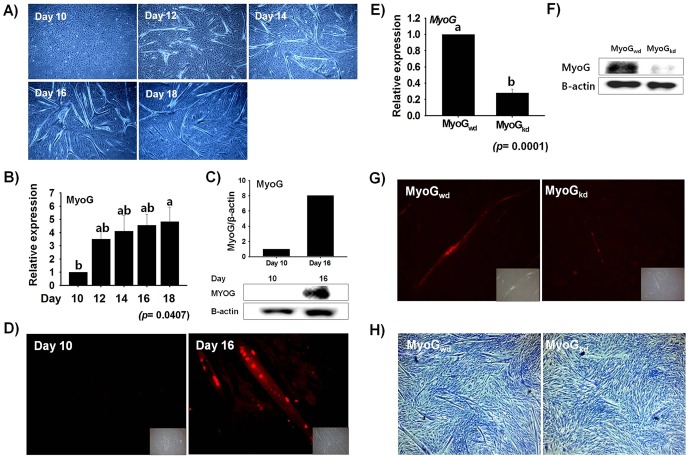
Figure 1. Myogenesis is associated with increased MyoG expression.
A) MSCs proliferation and differentiation in DMEM/10% FBS media. Myotube formation was observed from day 12, reaching a maximum at day 16. B) MyoG expression from RNA extracted and analyzed by real time RT-PCR. MyoG expression gradually increased with time. C) MyoG protein expression at Day 10 and Day 16 was determined by Western blot analysis and the protein intensity was measured by using Image J program. MyoG protein in Day 16 cells was significantly higher than in Day 10 cells. D) Immunocytochemistry analysis of Day 10 and Day 16 cells stained with MyoG antibody. Day 16 showed higher MyoG nuclear expression as compared with Day 10 proliferating cells. E)& F) MyoG mRNA and protein expression of MSCs transfected with MyoG shRNA. MyoG expression was decreased in both RNA and protein level in MyoGkd cells relative to MyoGwd cells. G) Immunostaining of MyoGwd or MyoGkd cells with MyoG antibody. A significant decrease in nuclear MyoG protein expression was observed in MyoGkd cells. H) Giemsa staining performed in MyoGwd and MyoGkd cells. Myotube formation was decreased in MyoGkd cells relative to MyoGwd cells. Day 10 and MyoGwd represents control, respectively (mean ±S.D., n = 3). p-value indicates the statistical significance of the data and different letters (a and b) in graph show significant differences among groups.

