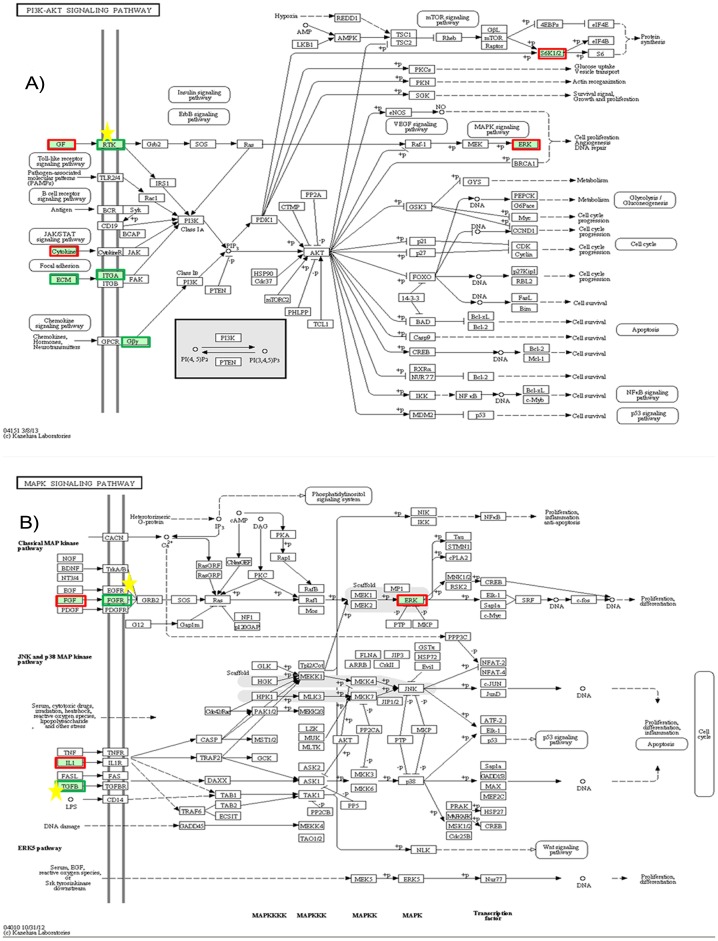
Figure 5. KEGG pathway map analysis of differentially expressed genes (≥4-fold change).
Among the various different pathways reported by KEGG analysis, two representative pathways A) PI3K-AKT and B) MAPK are shown. For each rectangular shape, red and green borders indicate up-regulated and down-regulated genes, while the yellow star indicates a role of phosphoprotein. Each KEGG pathway analysis figure depicts the role or involvement of a specific gene or a family of related genes at a particular location in the pathway. For instance, the FGF gene in KEGG MAPK pathway map represents the other FGF members (such as FGF10, FGF11, FGF12, etc) as well that may or may not be affected. Here, FGF represents all the members of fibroblast growth factor family. For FGF family members, the gene that exhibited >4 fold increase includes FGF11 whereas FGF10, FGF16, and FGF18 showed >1 fold increase in their expression rates. Conversely, the other FGF members that showed <4 fold decreased expression include FGF12 and FGF14. Similarly, FGFR represents the other members (FGFR1, FGFR2, etc) of this family of receptors as well. In case of FGFR family, FGFR2 showed >4 fold decrease in its expression, and FGFR4 exhibited >1 fold decrease in its expression rate. However, FGFR1 and FGFR3 showed about 1 fold increase in their expressions.

