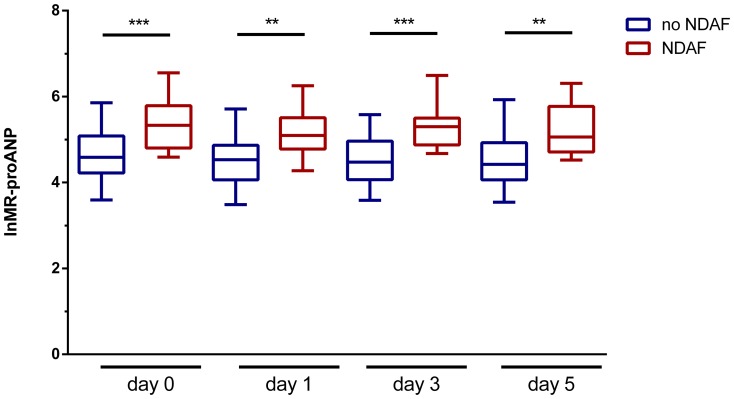
Figure 2. Timecourse of plasma MR-proANP levels.
Plasma lnMR-proANP levels are plotted on the ordinate, lnMR-proANP levels were significantly different between patient groups throughout the monitored period (day 0 denotes the day of admission; ** p<0.01, *** p<0.001, one-way ANOVA with Bonferroni’s multiple comparisons post-hoc test). The abscissa denotes the time points of plasma MR-proANP levels during the hospitalization period in patients with no newly-diagnosed atrial fibrillation (no NDAF, blue boxes) and those with newly-diagnosed atrial fibrillation (NDAF, red boxes). Horizontal bars indicate group means with error bars denoting 95% CI.

