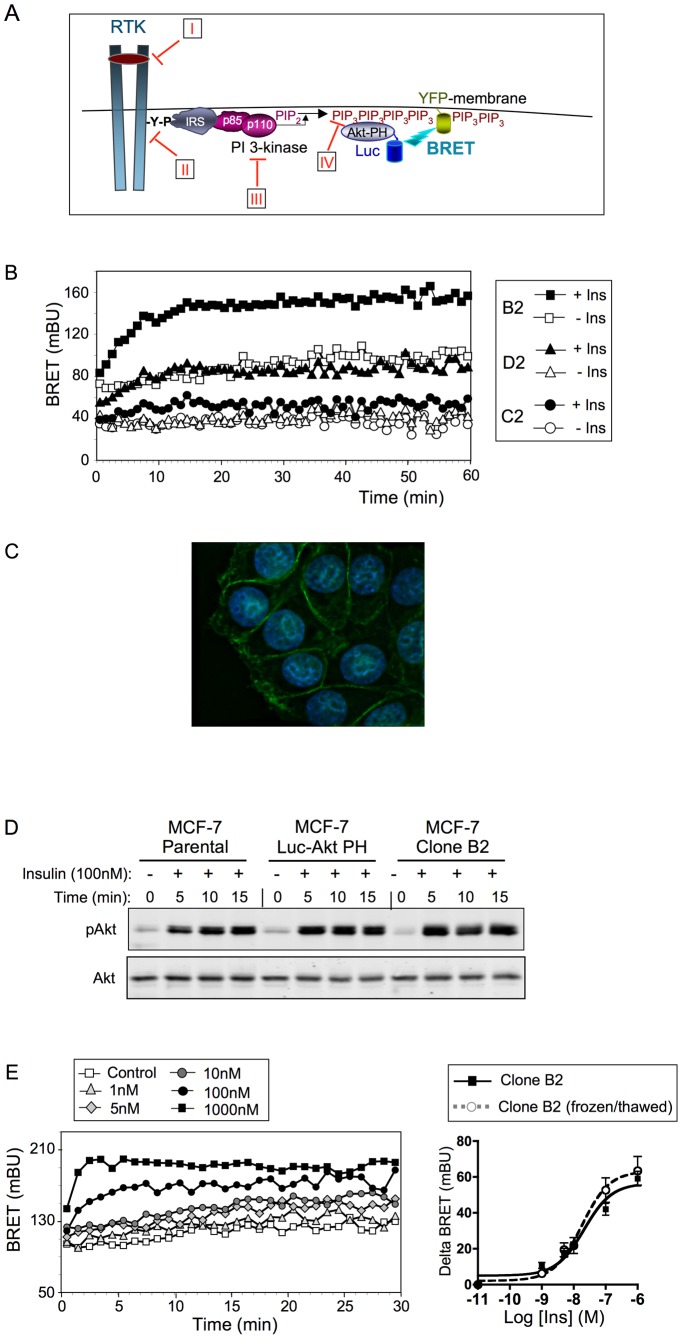
Figure 1. Development of a human breast cancer-derived clone stably expressing a BRET-based PIP3 biosensor.
(A) Principle of the BRET-based assay used to monitor PIP3 production in living cells. Activation of the PI-3 kinase by tyrosine kinase receptors induces phosphorylation of PIP2 into PIP3 and recruitment of Akt to the plasma membrane through its PH domain. To monitor PIP3 production, MCF-7 cells were stably transfected with the PH domain of Akt fused to luciferase (Luc-Akt-PH) and YFP fused to a membrane localization sequence (YFP-membrane). Recruitment of Luc-Akt-PH to the plasma membrane by PIP3 results in energy transfer between Luc-Akt-PH and YFP-membrane. This permits to study the pharmacological properties of ligands that activate this pathway, and to evaluate the effects of inhibitory molecules acting on (I) the extracellular part of receptors, (II) the tyrosine kinase activity of the receptors, (III) the catalytic activity of the PI3K, and (IV) the interaction between PIP3 and the PH domain of Akt. (B) Transfection of a MCF-7 clone stably expressing Luc-Akt-PH with YFP-membrane cDNA gave rise to 4 sub-clones stably expressing both constructs. Ligand-induced BRET could be detected in only 3 sub-clones (B2, D2, C2). Preliminary BRET experiments indicated that insulin-induced BRET was higher with clone B2. (C) Surface expression of pEYFP-Mem in MCF-7/B2 cells was studied by fluorescence microscopy. YFP fluorescence was detected using a FITC filter and nuclei were visualized using a DAPI filter. The image was obtained by deconvolution analysis. (D) Western-blotting experiment showed that expression of Luc-Akt-PH alone or together with YFP-membrane does not affect insulin-induced phosphorylation of endogenous Akt. (E) Insulin dose-dependently stimulated PIP3 production in MCF-7/B2 cells. Left panel: typical real-time experiment showing basal and insulin-stimulated BRET. Right panel: insulin-induced BRET (BRET above basal at the plateau) was determined for each insulin concentration to establish dose-response curves. Results are means ± S.E.M. (standard error of the mean) of 6 to 11 independent experiments. The freeze-thaw cycle did not affect the sensitivity of the cells to insulin stimulation.

