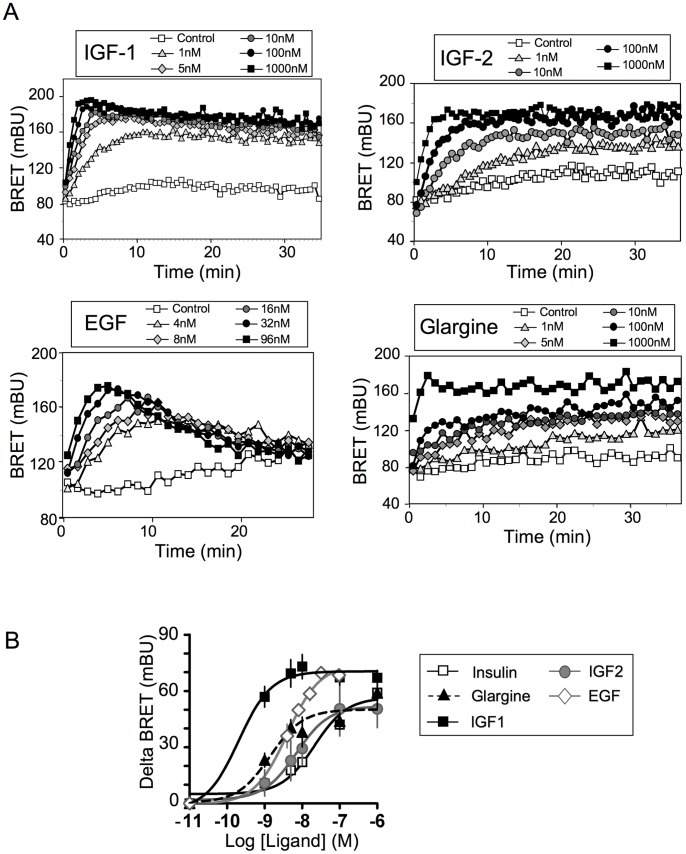
Figure 2. Effect of IGF1, IGF2, EGF and glargine on PIP3 production in MCF-7/B2 cells.
(A) Typical experiments showing real-time effects of IGF1, IGF2, EGF and glargine on PIP3 production in MCF-7/B2 cells. (B) Dose-dependent effect of IGF1, IGF2, EGF, glargine and insulin on PIP3 production in MCF-7/B2 cells. Ligand-induced BRET (BRET above basal) at the plateau (IGF1, IGF2, Insulin, Glargine) or at the peak (EGF) was determined for each ligand concentration and was used to establish dose-response curves. Results are means ± S.E.M. of 3 to 8 independent experiments. EC50 for insulin, IGF1, IGF2, EGF and glargine are given in the result section.

