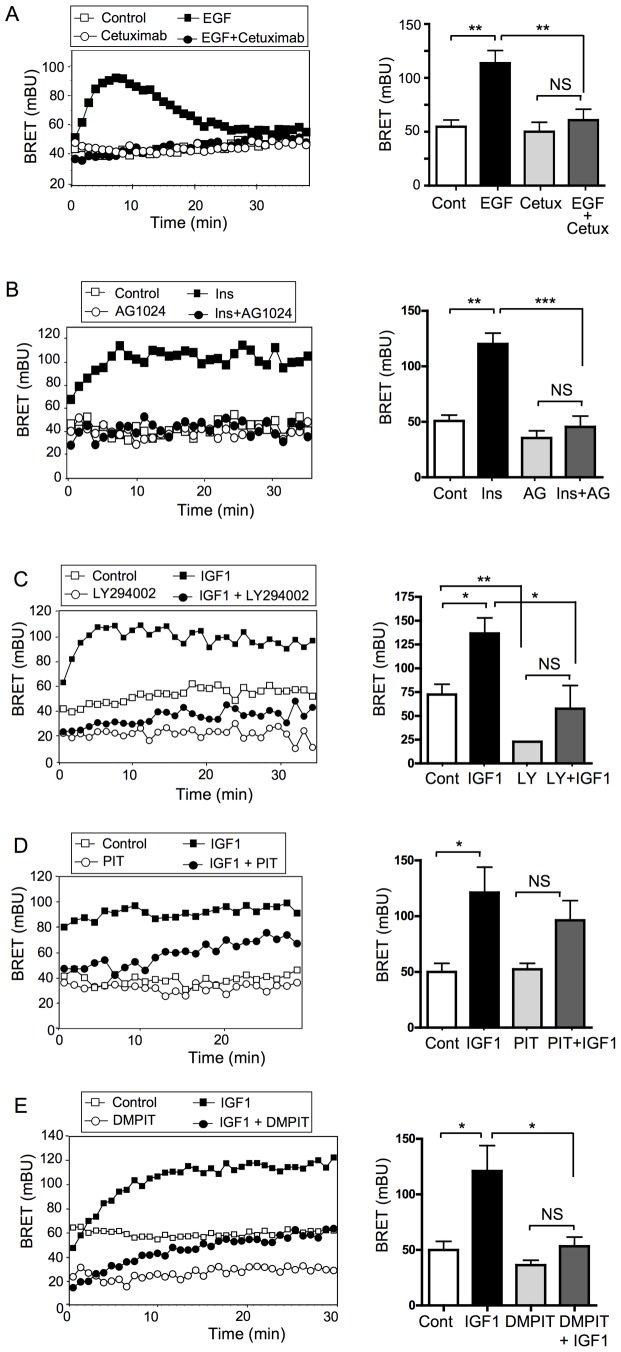
Figure 3. Effect of inhibitors of the PI3K/Akt signaling pathway on BRET signal in MCF-7/B2 cells.
(A) MCF-7/B2 cells were preincubated for 1 h in absence or presence of 20 ng/μl of the humanized anti-EGFR antibody Cetuximab. Cells were then stimulated with EGF (32 nM), and light emission acquisition started immediately. A typical real-time BRET experiment (left panel) and the mean ± SEM of BRET values at the peak (right panel) are shown (n = 3). (B) MCF-7/B2 cells were preincubated for 1 h in absence or presence of 25 μM of the tyrphostin AG1024. Cells were then stimulated with 100 nM insulin, and light emission acquisition started immediately. A typical real-time BRET experiment (left panel) and the mean ± SEM of BRET values at the plateau (right panel) are shown (n = 3). (C) MCF-7/B2 cells were preincubated for 1 h in absence or presence of 25 μM of the PI3K inhibitor LY294002. Cells were then stimulated with 10 nM IGF1 and light emission acquisition started immediately. A typical real-time BRET experiments (left panel) and the mean ± SEM of BRET values at the plateau (right panel) of 3 independent experiments are shown. (D, E) MCF-7/B2 cells were preincubated for 4 h in absence or presence of 10 μM of the inhibitors of Akt-PH/PIP3 interaction PIT-1 (D) and DMPIT-1 (E). Cells were then stimulated with 10 nM IGF1, and light emission acquisition started immediately. Typical real-time BRET experiments (left panels) and the mean ± SEM of BRET values at the plateau (right panels) of 3 to 4 independent experiments are shown. Statistical analysis was performed using ANOVA followed by Tukey’s test. *, P<0.05; **, P<0.01; ***, P<0.001; NS, Non significant.

