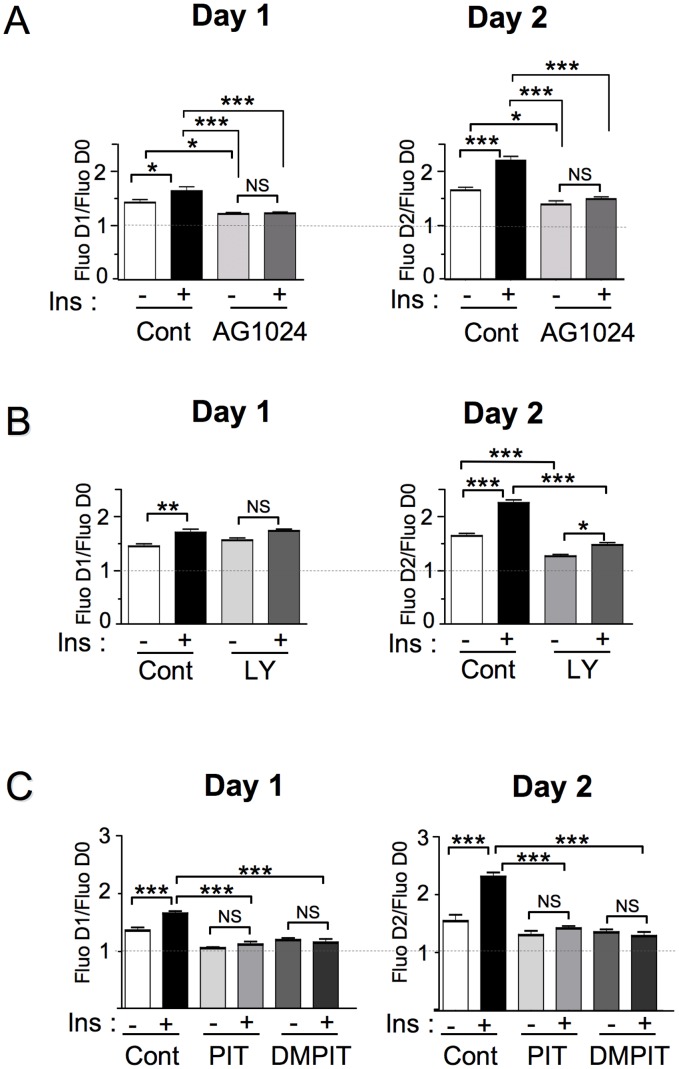
Figure 4. The effects of treatments on MCF-7/B2 cell proliferation can be monitored by YFP fluorescence measurement.
MCF-7/B2 cells were plated in 96 well plates at a density of 15000 cells/well. 24 h after plating, YFP fluorescence in each well was measured at 530 nm after excitation at 480 nm (D0). Cells were then treated with ligands and/or inhibitors, and fluorescence measurements were performed 24 h (D1) and 48 h (D2) later using a Typhoon Laser scanner. The effects of treatments on cell proliferation were estimated by dividing the fluorescence after treatment by initial fluorescence. Background fluorescence of the cells was obtained by culturing in parallel MCF-7/Luc-Akt-PH cells under the same experimental conditions. (A) Cells were cultured in presence of 1 μM of insulin in absence or presence of the 25 μM of AG1024 (B) Cells were cultured in presence of 1 μM of insulin in absence or presence of 50 μM of the PI3K inhibitor LY294002 (C) Cells were cultured in presence of 1 μM of insulin in absence or presence of 10 μM of the inhibitors of Akt-PH/PIP3 interaction PIT-1 and DMPIT-1. Mean ± SEM of fluorescence ratios of 3 to 4 independent experiments are shown. Statistical analysis was performed using ANOVA followed by Tukey’s test. *, P<0.05; **, P<0.01; ***, P<0.001; NS, Non significant.

