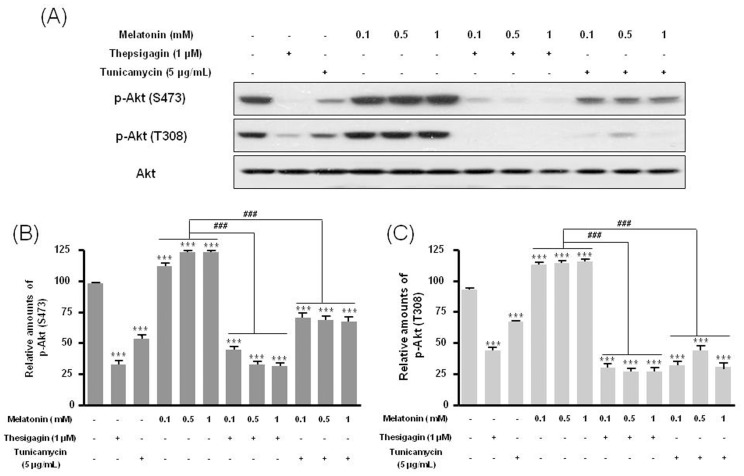
Figure 3. Phosphorylation of Akt (Ser473) and Akt (Thr308) in B16F10 cells after melatonin with or without thapsigargin or tunicamycin treatment.
B16F10 cells were cultured with or without melatonin (0.1, 0.5, 1 mM) and/or thapsigargin (1 μM) for 6 hr or tunicamycin (5 μg/mL) for 16 hr. p-Akt (Ser473) and p-Akt (Thr308) were analyzed by Western blot (A). Relative amounts of p-Akt (Ser473) (B) and p-Akt (Thr308) (C) quantified as described in Materials and methods. Data are mean ± SD of three experiments. ***P<0.001 vs. untreated control; ### P<0.001, melatonin vs. melatonin with thapsigargin or tunicamycin.

