
FIGURE 3.
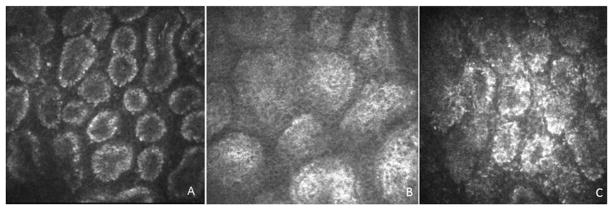
Representative confocal microscopy of MGs scans of (A) normal control subject, (B) MGD patients and (C) SS patient. Please note the decreased density and the enlargement of acinar unit and the increased secretion reflectivity in MGD patient (B). SS patient shows small acinar units, with increased density of inflammatory cells and increased inhomogeneity of the periglandular interstice (C).