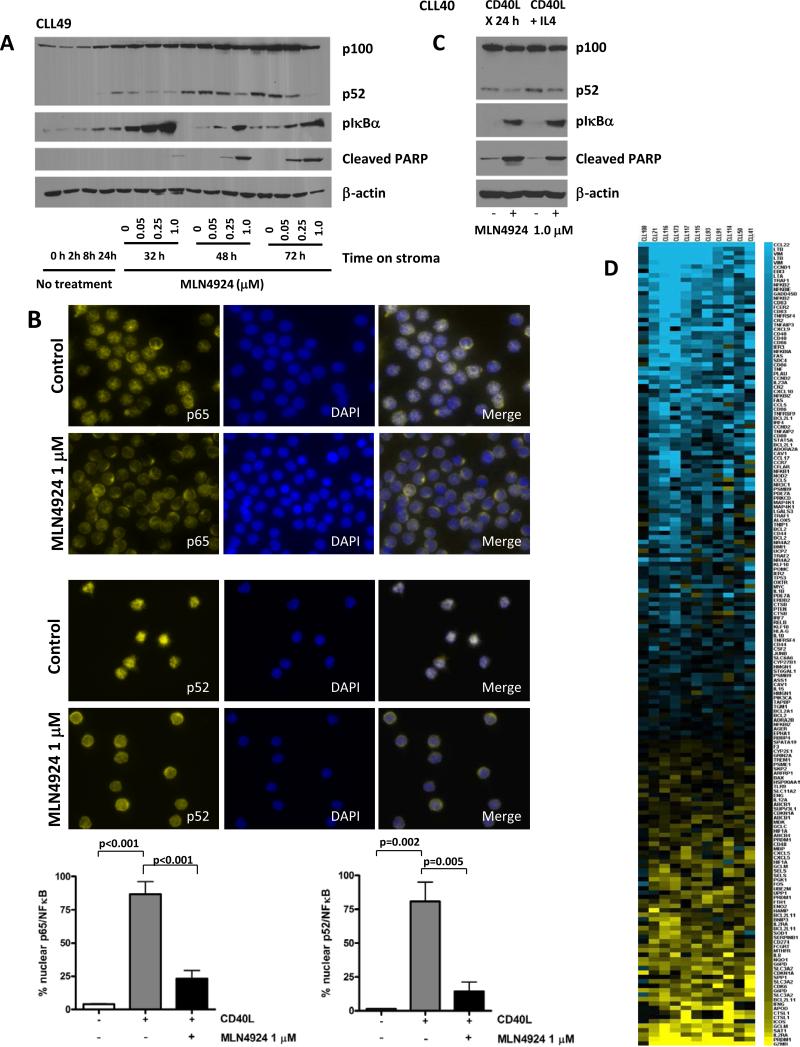
Fig. 3. MLN4924 reverses NFΔB activation in CLL cells.
(A) CLL cells were co-cultured with CD40L-expressing stroma for 24 hours and subsequently incubated with the indicated doses of MLN4924 for 8 - 48 hours. Whole-cell lysates were subjected to immunoblotting. Results from 1 of 4 experiments are shown. (B) CLL cells (N=8) were cultured on CD40L-expressing or parental stroma for 24 hours, followed by incubation with 1 μM MLN4924 for additional 24 hours and immunostained with p65 or p52/p100 antibodies. Nuclei were counterstained with 4,6-diamino-2-phenylindole. A representative case of CLL cells cultured on CD40L-expressing stroma in presence or absence of MLN4924 is shown. 100 cells per sample were scored for expression of p65 or p52 in the nuclear compartment. A comparison of nuclear expression of p65 and p52 in CLL cells co-cultured with either parental or CD40+ L cells, the latter with or without 1 μM MLN4924, is shown in the lower panels. Data are the mean ± SE. (C) CLL cells were co-cultured with CD40L-expressing stroma for 24 hours in the presence or absence of 10 ng/ml IL4. Thereafter, cell were incubated with 1 μM MLN4924 for 24 hours. Whole-cell lysates were subjected to immunoblotting. Results from 1 of 3 experiments are shown. (D) Gene expression profiling reveals a decrease in NFκB-driven gene signature pattern upon treatment with MLN4924. CLL cells were co-cultured with CD40L-expressing stroma for 18 hours and treated or not with 1 μM MLN4924 for additional 24 hours. RNA was isolated from the purified CLL B-cells and microarray analysis was performed as described in the methods. The heat map (left panel) represents a change in expression of the 181 putative NFκB target genes. Blue represents gene downregulation and yellow represents gene upregulation across the individual CLL samples (N=11).

