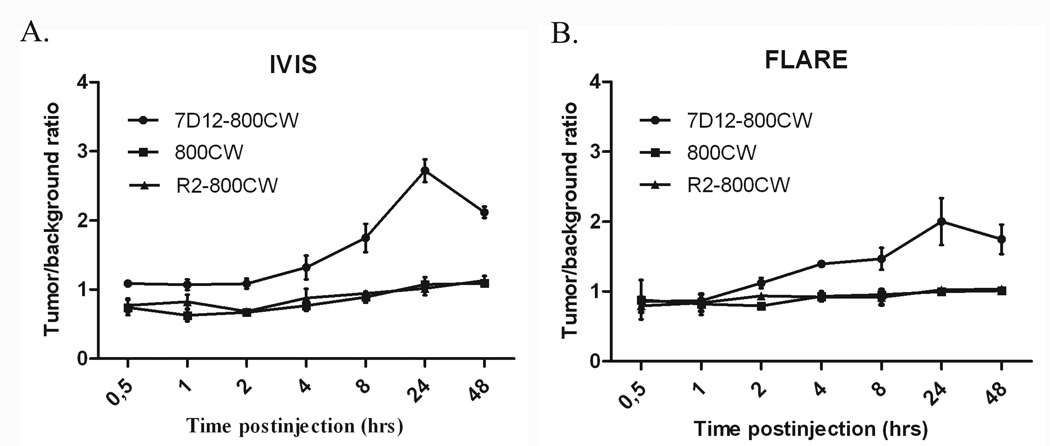
Figure 4. Intraoperative tumor to background ratios over time.
The tumor to background ratio of 7D12-800CW is significantly higher compared to those of R2-800CW and 800CW. Tumor to background ratios were calculated from 0.5 hours to 48 hours after injection. Error bars indicate the standard deviation. Tumor to background ratios were plotted for the IVIS-Spectrum (A) and the FLARE imaging system (B).

