
Figure 8.
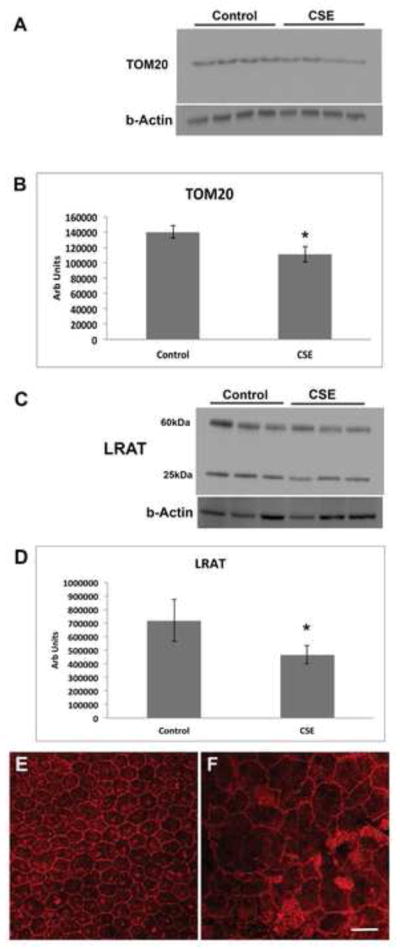
Intravitreal CSE induces epithelial-mesenchymal transition. Mice were given intravitreal injection of 250ug/ml CSE or vehicle control. A. Western blot of TOM20 using b-Actin as a loading control. B. Graph showing decreased TOM20 in the RPE/choroid 7 days after CSE treatment; n=4 eyes per condition. *p<0.05. C. Western blot of LRAT using b-Actin as a loading control. The 25kDa band represents the monomer and the 60kDa band represents the dimer. D. Graph showing decreased LRAT (monomer and dimer) in the RPE/choroid 7 days after CSE treatment; n=3 eyes per condition. *P<0.05. E. Representative confocal micrograph of an RPE flatmount of a vehicle control injected eye 10 days after CSE treatment. Note the regular cobblestone shape of the RPE and the regular ZO-1 immunostaining at the cell periphery. F. Representative RPE flatmount of CSE injected eye showing enlarged, irregularly shaped RPE with variable ZO-1 immunostaining compared to E, which was imaged at the same magnification. n=4 eyes per group. Bar=25um.