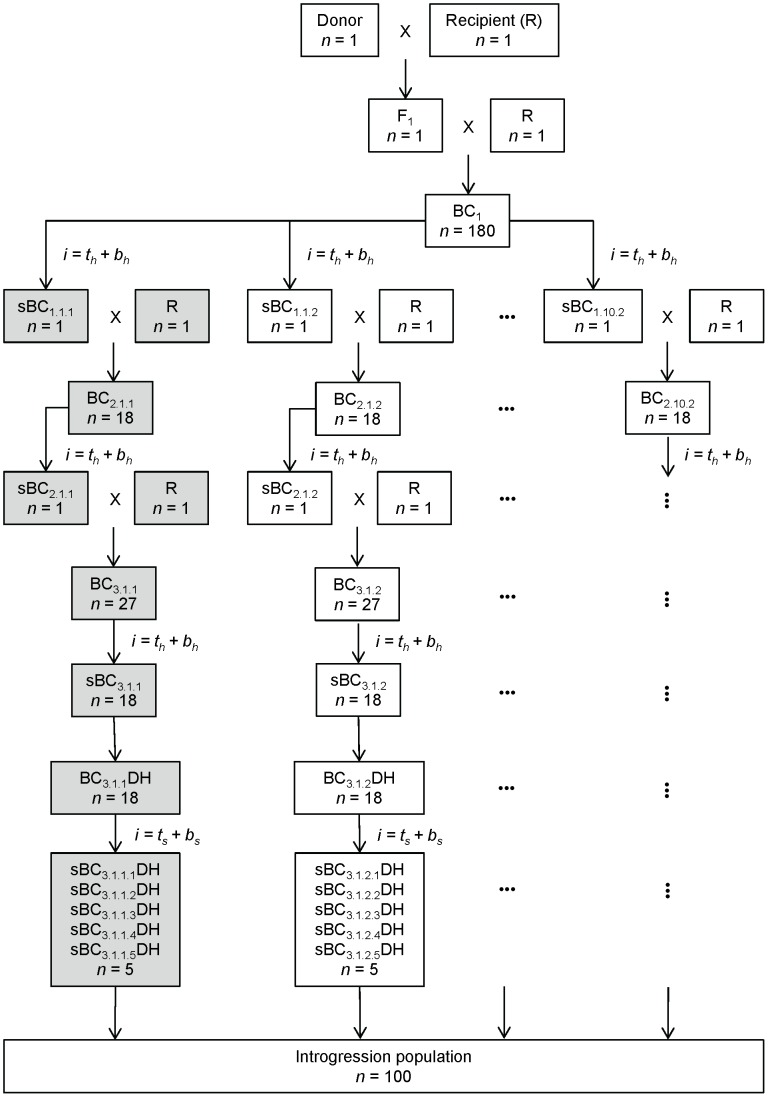
Figure 1. Schematic representation of crossing scheme  .
.
Crossing scheme  is characterized by increasing population sizes in the backcross generations and selection for donor chromosome halves in the final backcross generation. The parts highlighted in gray represent one branch of the crossing scheme. Sub-populations are indexed by
  ,
,  and
and  , where
  is the respective backcross generation,
  is the respective chromosome,
  is the respective chromosome half,
  is the respective target segment;
  and
and  denote individuals selected for the respective selection regions.

