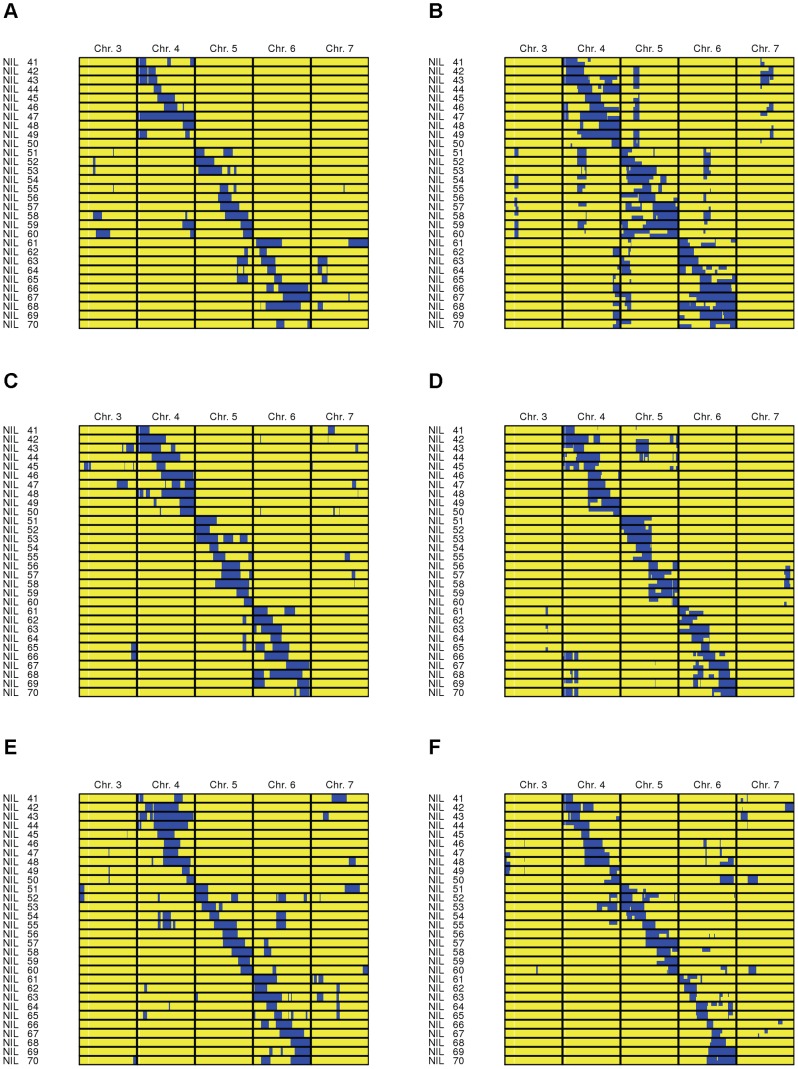
Figure 3. Graphical genotypes of introgression populations resulting from six different crossing schemes.
A:  ; B:
; B:  ; C:
; C:  ; D:
; D:  ; E:
; E:  ; F:
; F:  . The graphical genotypes display the chromosomes 3 to 7 of ILs 41–70 and are examples from one simulation run. Chromosome segments which stem from the donor are displayed in blue, whereas chromosome segments which stem from the recipient are displayed in yellow. The graphical genotypes illustrate the differences between the alternative crossing schemes with respect to their suitability to create introgression populations with complete donor genome coverage and clearly separated, evenly distributed target donor chromosome segments.

