
Figure 5.
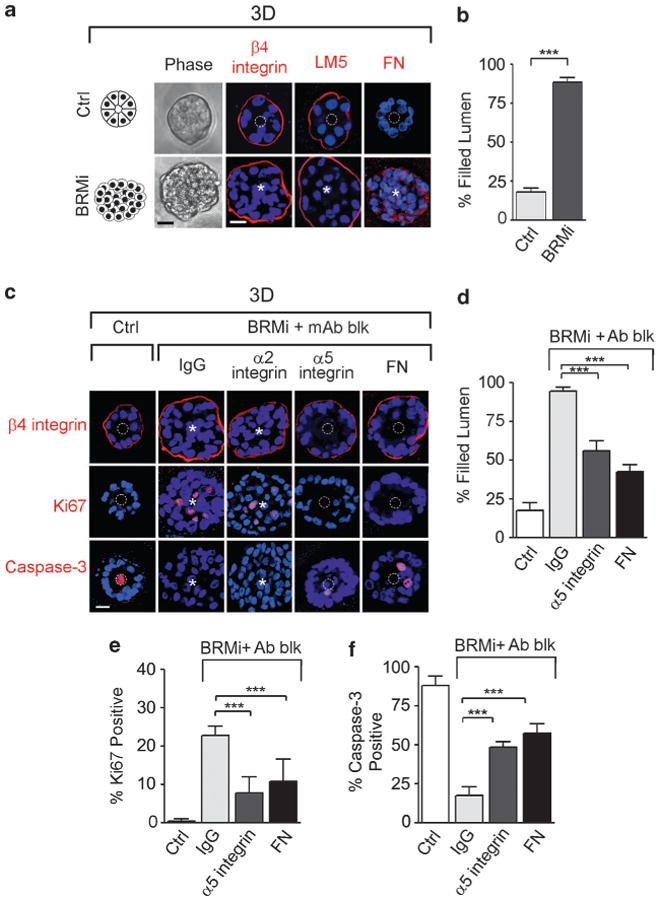
Loss of BRM expression enhances MEC 3D behavior by regulating fibronectin-α5β1 integrin interaction. MCF10A cells were transduced with inducible shRNA scrambled (control, Ctrl) or BRM (BRMi) knockdown constructs. (a) Left panels: phase-contrast pictures of Scrm and BRMi acini. Right panels: immunostaining (red) for integrin β4, laminin-5 (LM5) and fibronectin (FN); nuclei were visualized with 4′-6-diamidino-2-phenylindole (DAPI; blue). (b) Colonies in a were scored for the presence of a filled lumen. (c) BRMi cells were treated with α2 integrin, α5 integrin, FN function-blocking antibodies (mAb blk) or isotype control IgG (IgG), and stained for β4 integrin (red), cleaved caspase-3 (red) and Ki67 (red); nuclei were visualized using DAPI (blue). (d–f) Graphs showing the percentage of filled lumens (d), Ki67 (e) and caspase-3 (f)-positive colonies. White dashed circles indicate cleared lumens; asterisks indicate the absence of a lumen. Scale bar, 25 μm. Results are the mean ± s.e.m. of five separate experiments (n>50 acini per sample; ***P<0.001).