
Figure 1. The univariate association between sleep apnea and all-cause mortality.
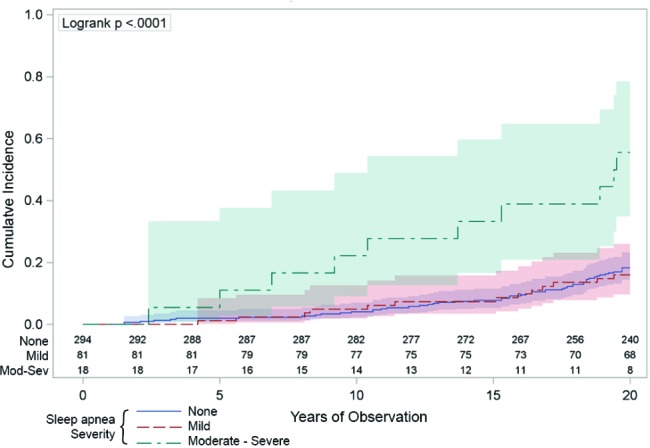
The vertical axis indicates the cumulative number of deaths was higher across the 20 years (horizontal axis) in those people with moderate-severe sleep apnea (respiratory disturbance index [RDI] ≥ 15/h: the green line) compared to those with mild sleep apnea (RDI 5-14: the red line) or those with no sleep apnea (RDI < 5: the blue line). The numbers just above the horizontal axis indicate the numbers of people being observed at each 2-year time point in each of the sleep apnea groups. The shaded areas around the lines represent the 95% confidence intervals.