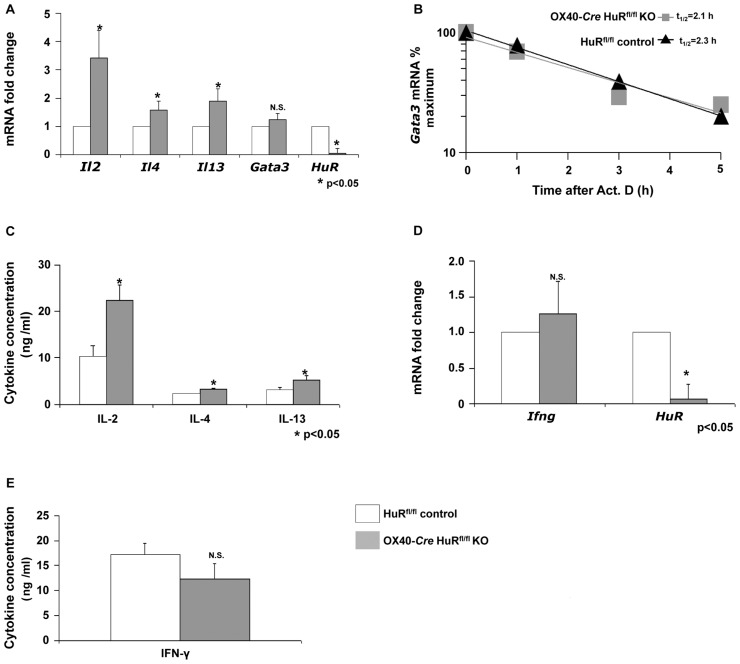
Figure 3.
Th2-polarized cells from OX40-Cre HuRfl/fl homozygous knockout mice display increases in Il2, Il4 and Il13 steady-state mRNA and protein levels. Real-time PCR analysis of Gata3, Il2, Il4 and Il13 mRNA in Th2-polarized cells. (B) Gata3 mRNA decay as assessed by real-time PCR in OX40-Cre HuRfl/fl and HuRfl/fl T cells (n = 3 for half-life). (C) ELISA of supernatants from Th2-polarized OX40-Cre HuRfl/fl mice. (D) Real-time PCR analysis of Ifng in Th1-polarized cells from OX40-Cre HuRfl/fl compared with HuRfl/fl control mice. (E) IFN-γ ELISA of supernatants from Th1-polarized OX40-Cre HuRfl/fl mice (error bars represent mean ± SEM; n = 3; *p < 0.05). N.S., not significant.

