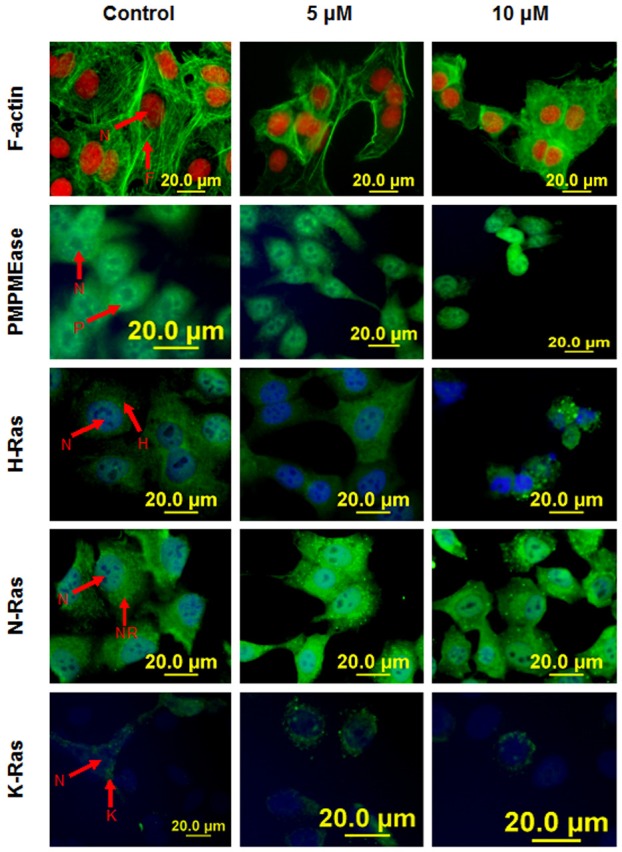
Figure 6.

Immunofluorescence analysis of PMPMEase inhibition on F-actin filaments and cellular localization of PMPMEase and Ras proteins. Cells treated with L-28 (0-10 μM) were fixed with 3.7% paraformaldehyde and permeabilized with 0.1% Triton X-100 as described in methods. These were then probed with FITC-labeled antisera directed against PMPMEase (P), H-Ras (H), N-Ras (NR), K-Ras (K) or RhoA (R). Cell nuclei (N) were labeled either with propidium iodide (red) or DAPI (blue). F-actin filaments (F) were stained green with fluorescein-conjugated phalloidin. Fluorescent images were captured using a fluorescent microscope equipped with propidium iodide and fluorescein band pass filters and an Olympus DP70 camera.
