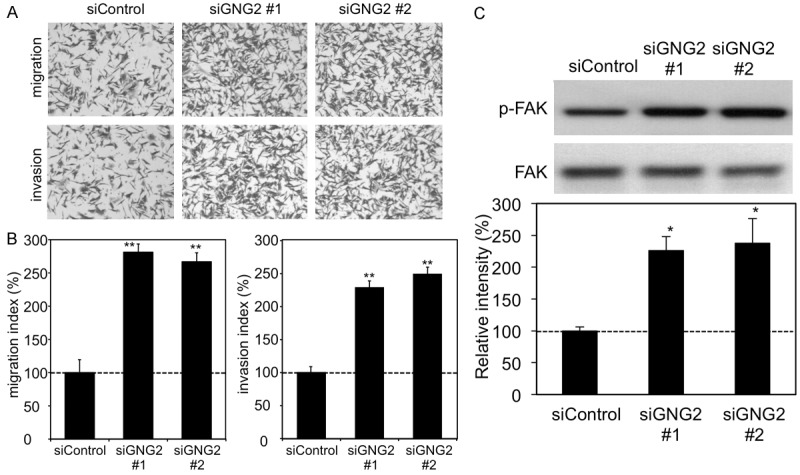
Figure 4.

Effect of GNG2 depletion on characteristics of A375P cells. (A) Cell migration (top panels) and invasion (bottom panels) of control (siControl) and GNG2-depleted (siGNG2 #1 and #2) A375P cells were examined by the Boyden chamber assay and Matrigel invasion assay, respectively. (B) Indexes of cell migration and invasion after incubation for 24 hrs are shown as percentages (mean ± SD; n=3) relative to siControl. (C) Phosphorylation and/or protein expression levels of FAK in control (siControl) and GNG2-depleted (siGNG2 #1 and #2) A375P cells are presented. Intensities of bands are presented as percentages (mean ± SD; n=3) relative to siControl. * and **, Significantly different (*, p<0.05; **, p<0.01) by Student’s t-test.
