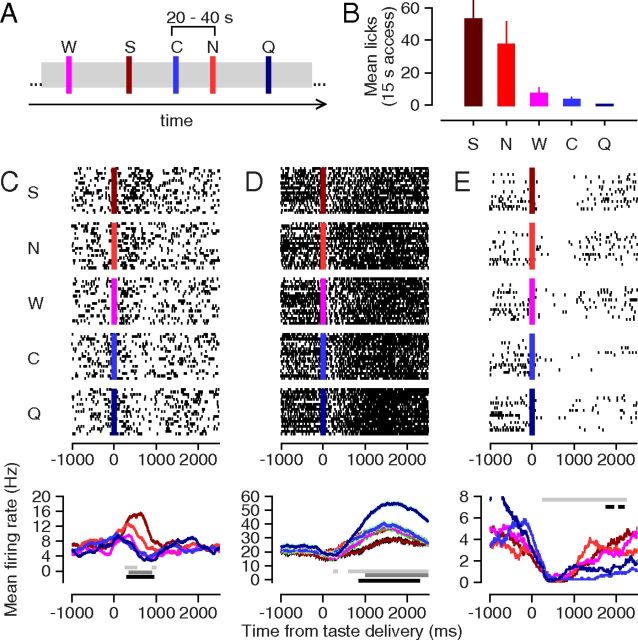
Figure 1.
Example LH responses to taste stimuli. A, A portion of the timeline of an example taste delivery experiment. Colored bars indicate individual deliveries of specific taste stimuli: brown (300 mm S), red (150 mm N), pink (distilled water, W), blue (10 mm C), and dark blue (2 mm Q). B, Relative palatability of the five different taste stimuli as determined by a brief access consumption test. Palatability is measured as the average number of licks per 15 s of exposure to the given stimulus. Error bars indicate SE measurements across animals (N = 7). C–E, The complete set of taste responses for three example LH neurons. Top panels, Spike rasters for all presentations of the five taste stimuli. Each row of a raster represents the spike train measured during a single taste delivery, and the colored bar indicates the moment of taste delivery. Bottom panels, Each trace represents the mean firing rate to one of the five tastes (colored as in A), smoothed with a 500 ms rectangular filter. Light gray lines, Period of significant taste responsiveness; medium gray lines, period of significant taste specificity; dark gray lines, period of significant palatability relatedness.

