Figure 2.
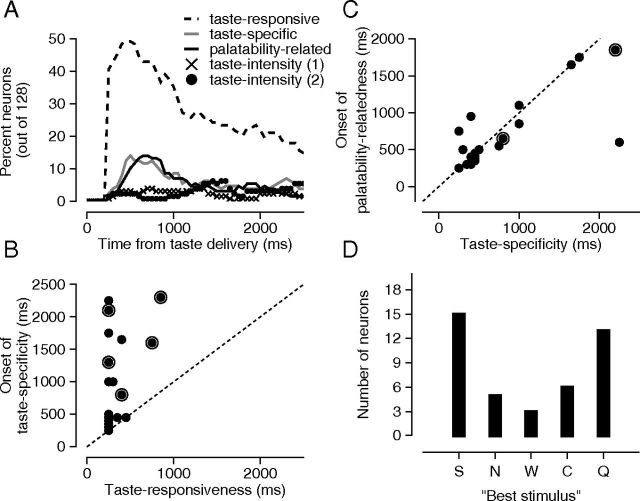
Time course of neural responses relating to different aspects of the taste experience. A, Each line represents the percentage of LH neurons with responses that were significantly taste responsive (dashed line), taste specific (gray line), or palatability related (black line) as a function of time with respect to taste delivery. The lines with Xs and Os represent the percentage of neurons whose responses exhibit statistically significant rank correlations with two different taste intensity functions (S = Q > N = C > W for the Xs; Q > S > C > N > W for the Os). B, For the 27 neurons with both significant taste-responsive and taste-specific responses, the onset of taste specificity (y-axis) is plotted against the onset of taste responsiveness (x-axis). C, For the 23 neurons with both significant taste-specific and palatability-related responses, the onset of palatability relatedness (y-axis) is plotted against the onset of taste specificity (x-axis). In both B and C, each symbol corresponds to the measurements from a single neuron, symbols with halos denote neurons with inhibitory responses, and the dashed diagonal line represents the unity line. All times are relative to taste delivery. D, The distribution of best stimuli for all 42 LH neurons with significant taste-specific responses, palatability-related responses, or both. The height of each bar indicates the number of neurons that responded most strongly to that particular taste.

