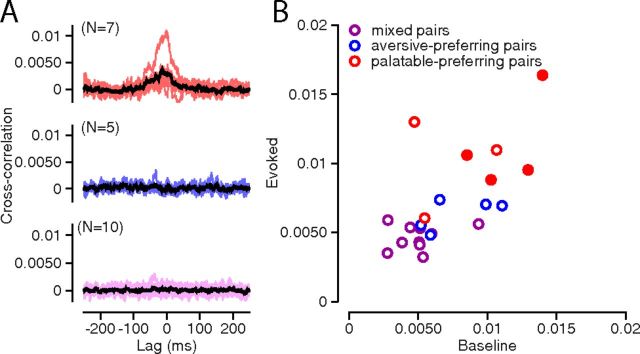
Figure 6.
Analysis of the functional connectivity strength between homogeneous and heterogeneous pairs of palatability-responsive neurons. A, Each panel shows the full set of raw cross-correlograms (x-axis, time from spike of arbitrarily selected neuron 1; y-axis, correlation reflecting likelihood of a spike in neuron 2) measured for a particular pair type. The top panel contains cross-correlograms from the evoked period for all pairs of palatable-preferring neurons (red traces), the middle panel, all pairs of aversive-preferring neurons (blue traces), and the bottom panel, all mixed pairs (purple traces). The thick black line in each panel denotes the average cross-correlogram for the particular pair type. To aid with visualization, each trace was smoothed with a 10 ms rectangular filter. B, For all pairs, the peak height of the cross-correlogram from the evoked period (y-axis) is plotted against the peak height from the baseline period (x-axis). The unsmoothed cross-correlograms were used to calculate the peak heights. Palatable-preferring, aversive-preferring, and mixed pairs are represented by red, blue, and purple symbols, respectively. Filled symbols correspond to pairs with statistically significant functional connectivities.

