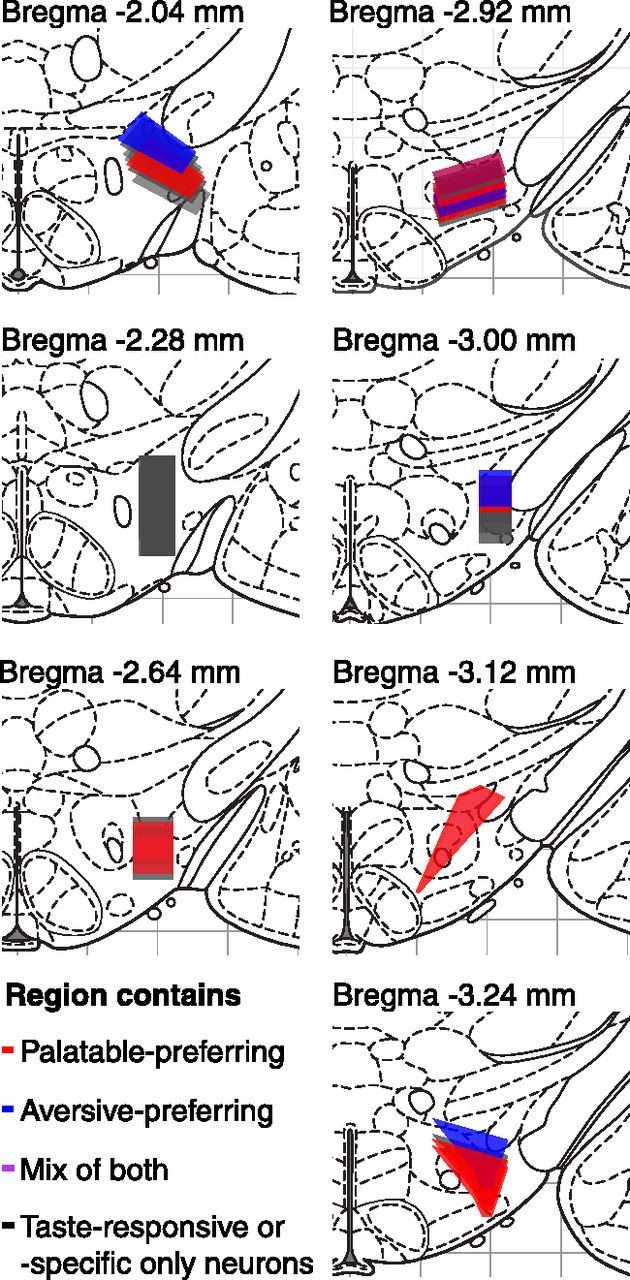
Figure 7.

Anatomical organization of the two types of palatability-responsive neurons. Red- or blue-shaded regions represent the extent of electrode tip locations from recording sessions that contained palatable- or aversive-preferring neurons. Regions that contained both types of neurons are denoted in purple, with the exact shade chosen to reflect the ratio of palatable-preferring to aversive-preferring neurons within that region. Black-shaded regions represent areas in which we did not find palatability-responsive neurons, but did find neurons with significantly taste-responsive or taste-specific responses.
