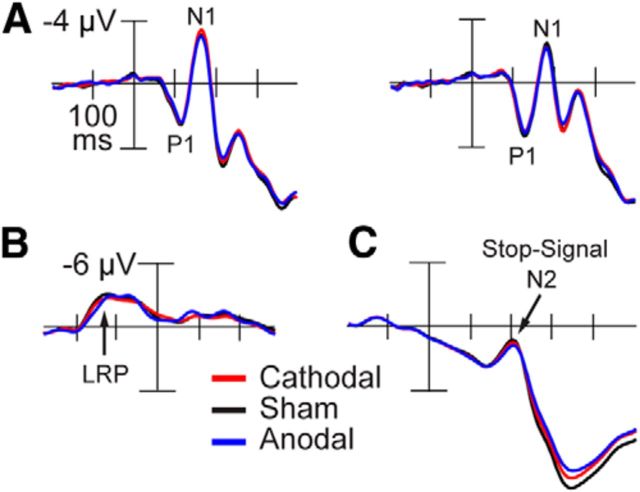
Figure 6.
Perceptual, response, and stop signal ERPs from Experiment 1. A, Target-locked grand average potentials from correct, no-stop trials shown at lateral occipitotemporal sites (OL/OR) contralateral (left) and ipsilateral (right) with respect to target location recorded during the sham (black), cathodal (red), and anodal (blue) conditions. Labels show P1 and N1 components. B, Response-locked grand average difference waves (contralateral − ipsilateral with respect to response hand) at central lateral electrodes (C3/C4) from correct no-stop trials across conditions as in A. Arrow indicates the LRP. C, Stop signal-locked grand average potentials on correct stop trials at the central midline electrode (Cz) across conditions as in A. Arrow indicates the prominent negativity (previously termed the stop-signal N2 component).

