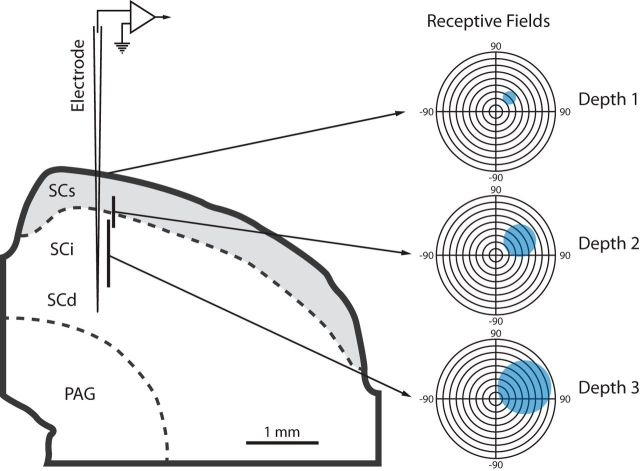
Figure 1.
Changes in visual RF size with increasing recording depth within the SC. Visual RF size increases with increasing depth within the SC. Electrode position at different recording depths in SC is represented on a schematic cross-section (left). Depth 1 represents recordings at the top of SC. Mappings and recordings at depth 2 varied between 200 and 600 μm from top of SC (mean depth across 55 sessions = 353 μm). Mappings and recordings at depth 3 varied between 1000 and 1400 μm from the top of SC (mean depth across 55 sessions = 1247 μm). Blue shaded regions (right) illustrate representative RF sizes at each of these depths.

