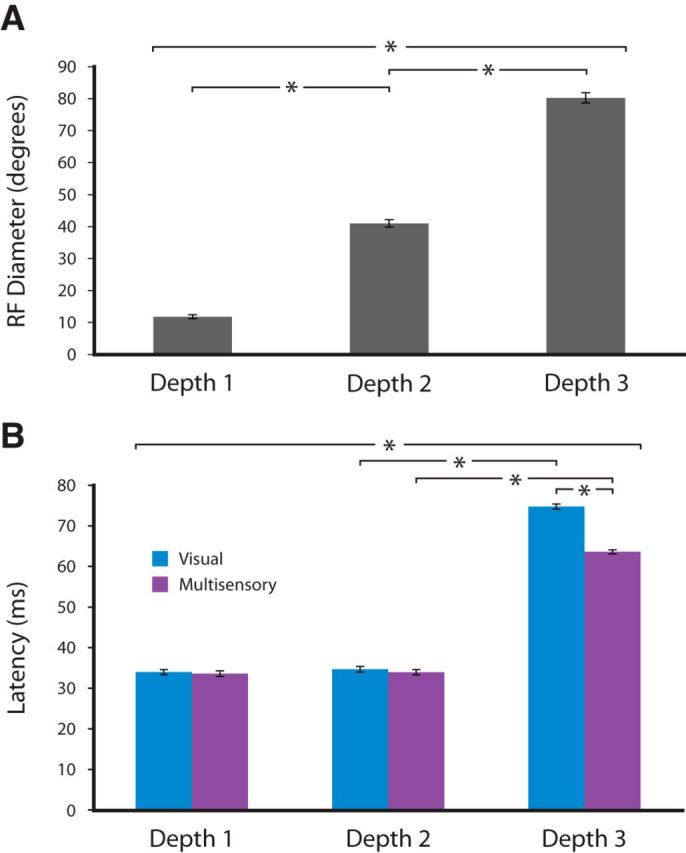
Figure 2.

Quantification of RF size and response latency as a function of depth. A, Mean RF diameters at each of the recorded depths. Asterisks represent statistically significant differences between groups (n = 55). B, Latency of visual alone and visual-auditory responses at the three depths.
