
Figure 3.
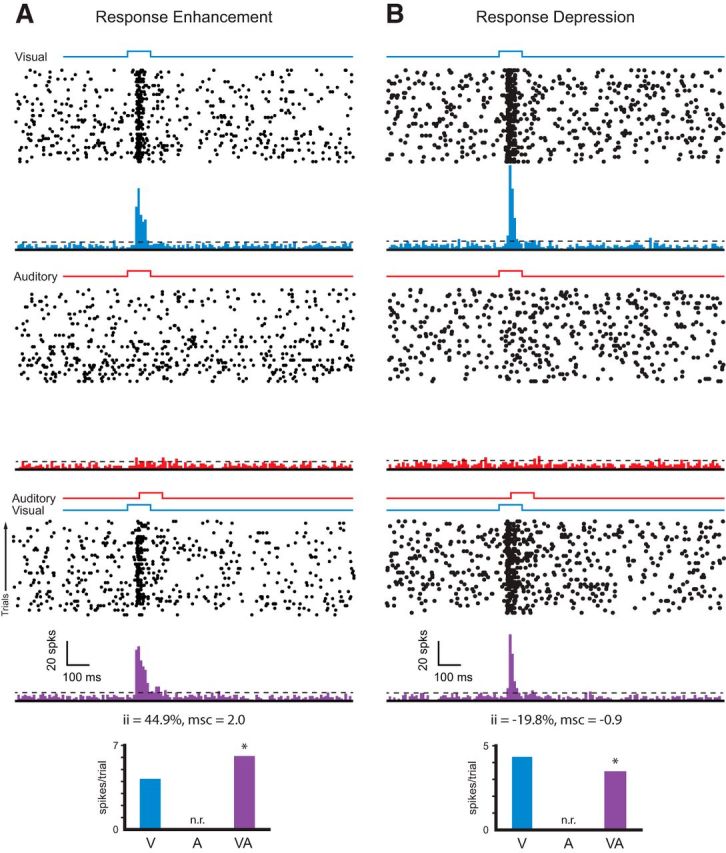
Spiking responses to visual, auditory, and combined stimulation in the superficial layers of SC. A, B, Representative example of MUA recorded from the superficial layers of SC showing response enhancement (A) and response depression (B). In each, rasters and PSTHs showing multiunit responses for visual (blue), auditory (red), and multisensory (purple) stimulation are shown. For the raster plots, each row represents a trial and each dot represents a spike. Onset and duration of visual and auditory stimuli are represented by blue and red square waves on top of the raster plots for each condition. Dashed horizontal line represents the threshold for neuronal response (i.e., 2 SDs above spontaneous activity). Bottom panels show the quantification of neuronal responses under the three stimulus conditions (V, A, and VA) as measured by ii and msc.