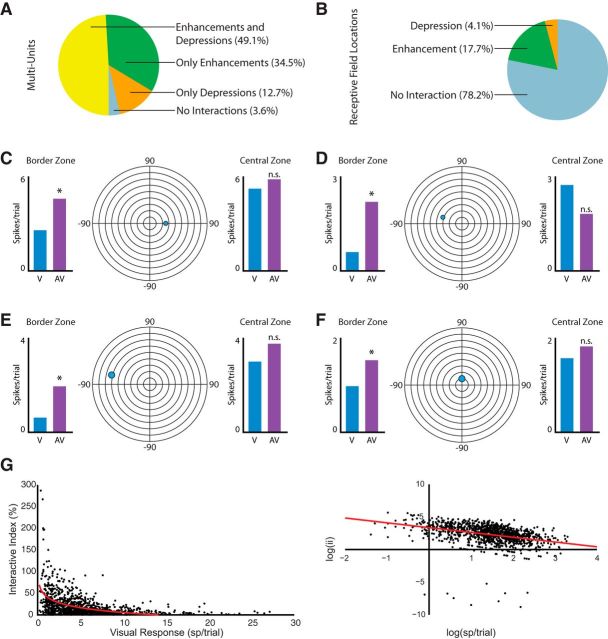
Figure 4.
Quantification of multisensory interactions in the superficial SC layers. A, Pie charts showing the proportion of multiunits showing different types of multisensory interactions at some position inside their RF in the superficial layers of SC. B, Pie charts showing the type of interactions sorted by RF location. C–F, Representative examples of four visual RFs recorded from the superficial layers of SC that showed significant response modulations (bar graphs) under multisensory conditions when stimuli were placed at either the borders or the central locations of the RF. Note that significant interactions are generally seen at the RF borders. G, Plots of ii as a function of visual response magnitude in both conventional (left) and log-log-transformed (right) representations. Note that as visual responsiveness increases, the amount of multisensory modulation decreases.

