
Figure 5.
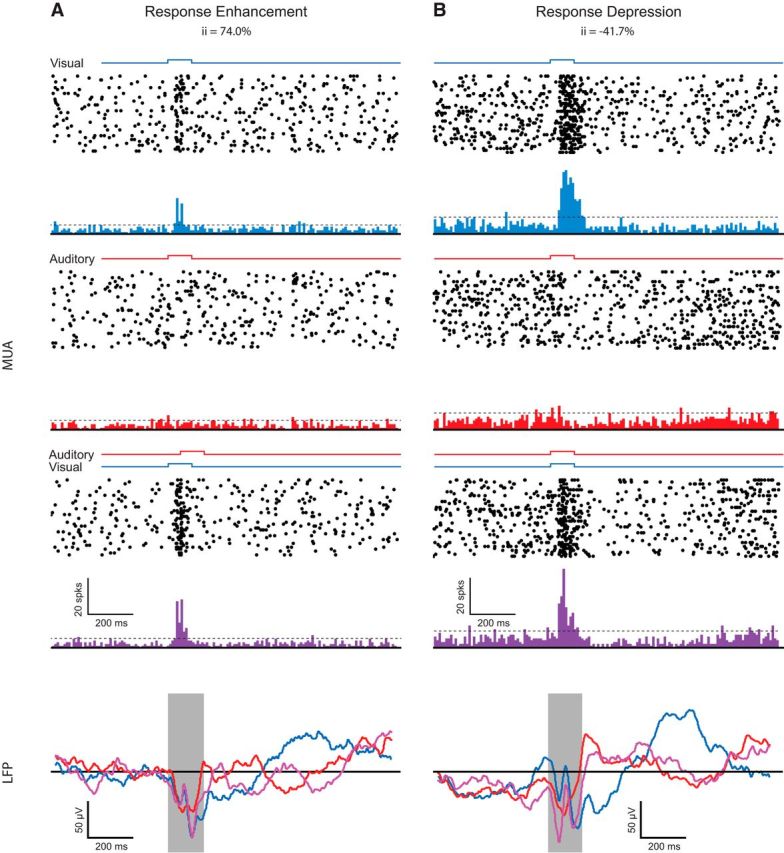
Spiking and LFP responses during multisensory stimulation. A, B, Top, Multiunit spiking response for an SC site showing response enhancement (A) and response depression (B). Bottom, Corresponding changes in the LFPs. Blue represents responses to the visual condition, red represents responses to the auditory condition, and purple represents responses to the multisensory condition for both the PSTHs and the evoked LFP traces. The onset and duration of stimuli are represented by square waves over the PSTHs for the different stimulus conditions. The shaded box over the LFP traces represent the duration of the multisensory stimulus combination (i.e., 150 ms).