
Figure 6.
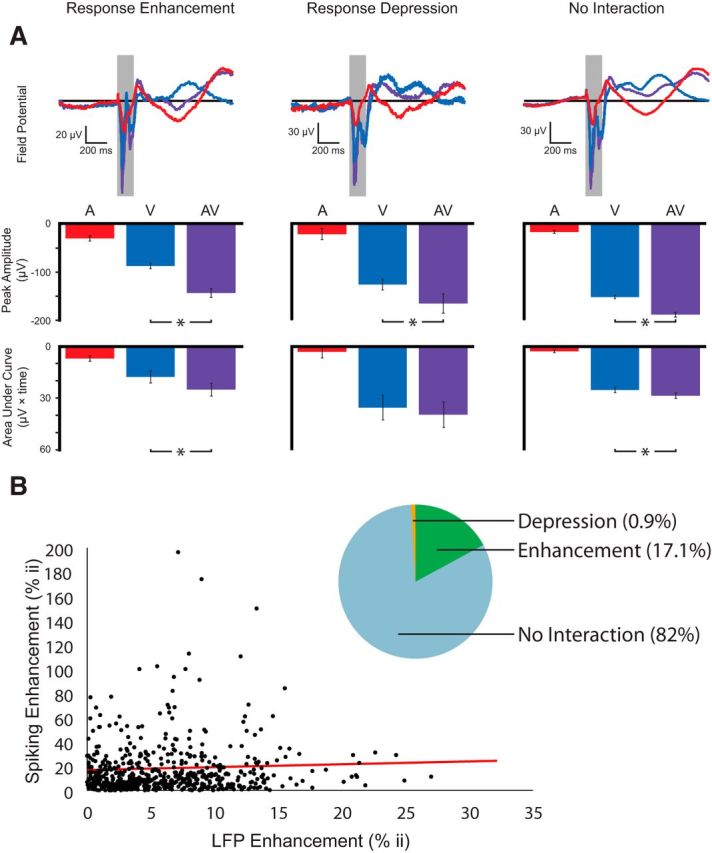
Quantification of evoked LFP amplitude in superficial layers of SC. A, Mean evoked LFP activity across all sites showing response enhancement, response depression, and no interaction for the V0A0 conditions. Top, Mean field potentials for these three conditions. Middle and bottom, Peak amplitude and AUC of the LFP, respectively. Asterisks represent statistically significant differences between groups. Statistical details are reported in Table 1. B, Pie chart showing the proportion of RF sites exhibiting response enhancement, response depression, and no interactions based on LFP responses. Correlation of multisensory modulations in spiking activity and LFP activity across RF sites (r = 0.0837, p = 0.03). The line of best fit is shown in red (y = 0.2319x + 16.789).