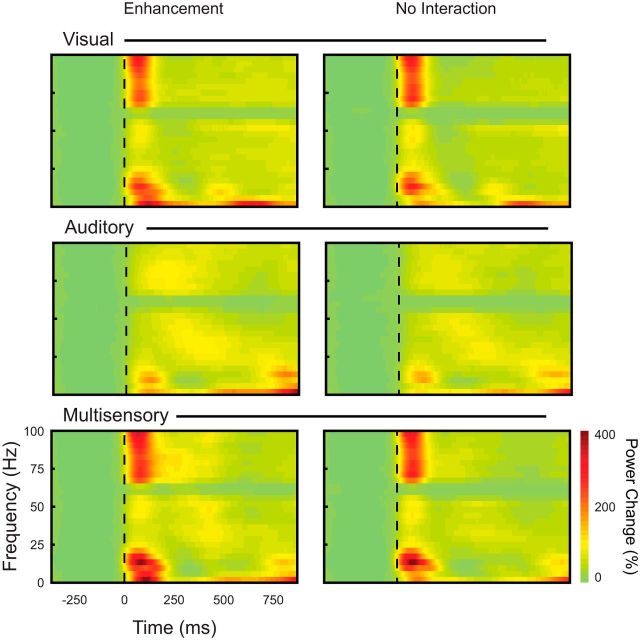
Figure 7.
Time-frequency analysis of LFP responses. Averaged time-frequency representations (spectrograms) of LFP responses recorded from the superficial SC for the V0A0 condition showing power changes for the visual, auditory, and multisensory stimulus conditions and for all stimulus locations showing response enhancements and no interactions. Colored bar at the bottom right represents the percentage of LFP power change compared with prestimulus baseline. The dashed vertical lines represent the onset of the visual stimulus.

