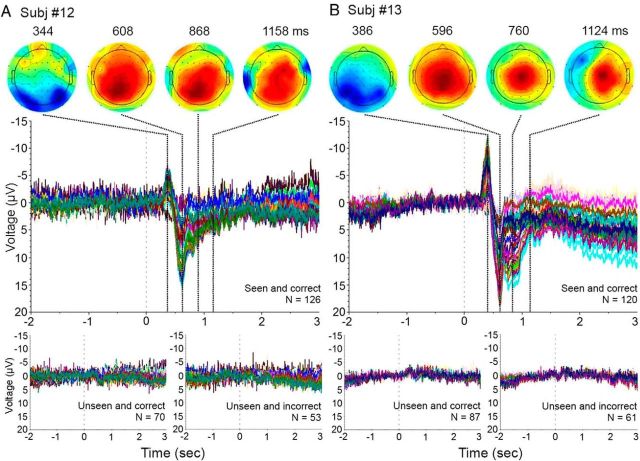
Figure 10.
DC-EEG data from Subj. #12 (A) and Subj. #13 (B). ERPs from all electrodes are shown for three conditions: Seen and correct (middle row), Unseen and correct and Unseen and incorrect (bottom row). The numbers of trials included in each condition are indicated in the figure. The scalp topography of voltage distribution at selected time points for the Seen and correct condition are shown in the top row.

