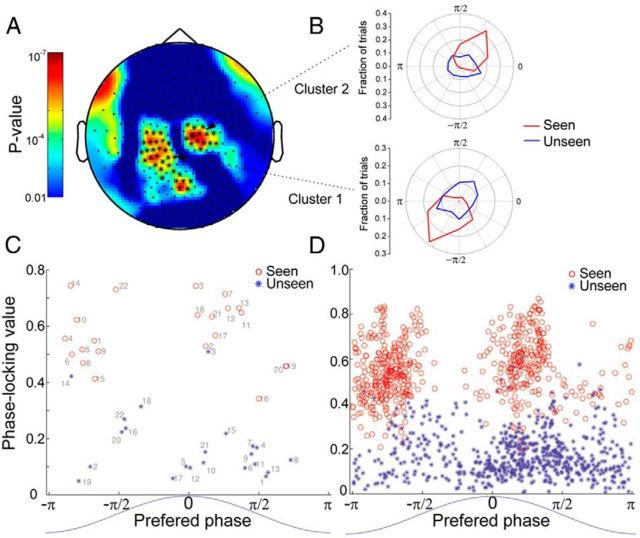
Figure 6.
Phase of low-frequency MEG activity in seen versus unseen trials. A, Scalp plot of p values for the effect of subjective awareness determined by the two-way ANOVA on phase (0.05–1 Hz activity at stimulus onset), from an example subject (Subj. #1). Two dominant sensor clusters are defined by the contour of p values (*p < 0.0001). B, The phase histograms for seen (red) and unseen (blue) trials for the two dominant clusters in A. C, PLV is plotted against preferred phase for the two dominant clusters from each subject, calculated for seen (red) and unseen (blue) trials separately. The numbers indicate the cluster number (from 1 to 22). D, PLV and preferred phase for all significant (p < 0.001, from ANOVA result for SUB effect) sensors in seen (red) and unseen (blue) trials, respectively. The blue sinusoidal curves at the bottom of C and D show that phase 0 relates to the peak of the fluctuation, and phase ± π to the trough of the fluctuation.

