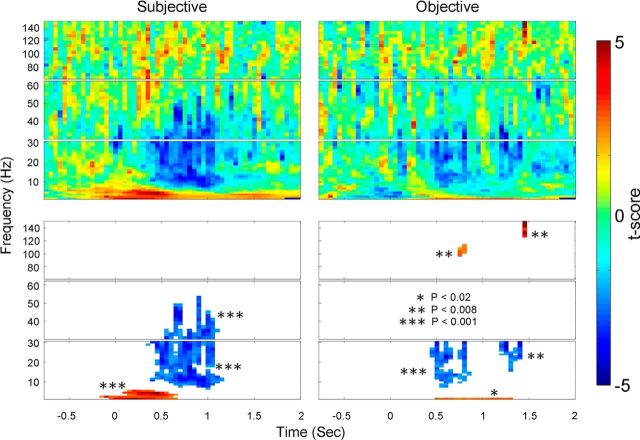
Figure 7.
Group analysis results on MEG power for the effect of subjective awareness (left) and objective performance (right). For each subject and at each time-frequency location, the t scores from a two-sample t test (seen vs unseen, or correct vs incorrect) were summed across significant sensors as determined by the ANOVA (ΣT, see Materials and Methods). The ΣT value was subjected to a population test across subjects (one-sample t test against 0), and the resulting t score is plotted as color (top). Warm colors indicate that power was higher in seen (left) or correct (right) trials; cool colors indicate that power was higher in unseen or incorrect trials. Bottom, Significant time-frequency clusters after controlling for multiple comparisons using a nonparametric permutation test. The statistical significance of each cluster is indicated in the graph; color is the same as in top, indicating the population-test t score.

