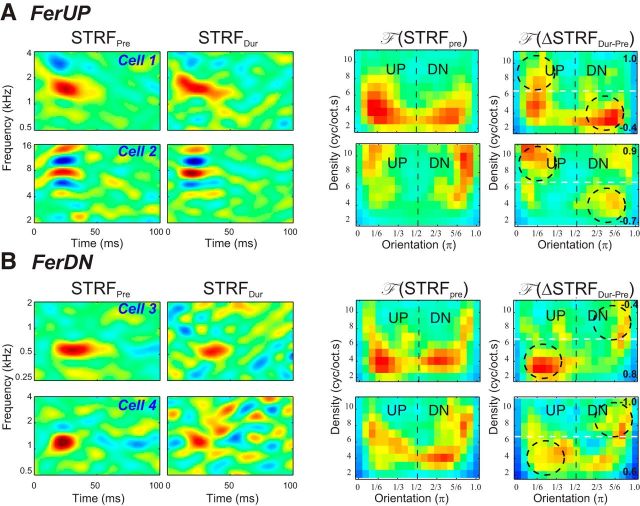
Figure 4.
Examples of STRF changes in A1 neurons during task performance. A, Examples of rapid changes in two single units from FerUP. For each unit, we illustrate the original STRF (left panels), the STRF during performing task (second panels from left), and the magnitudes of reversed-polar Fourier transform of the STRF (F (STRF)) (third panels from left) and the changes of STRF (F (ΔSTRF)) during performance of the task relative to the prior passive state (right panels). The STRFs adapted so as to enhance their sensitivity to the pitch shifts of the reference tone sequence (e.g., the downward sequence in FerUP). The asymmetry indices for LD and HD region of the reversed-polar transform are shown on the bottom and top right of each panel, respectively. As predicted in Figure 2B, both neurons show an enhancement of the asymmetry at low density toward the DN selectivity, which is highlighted by the dashed circles for (LD < 0). They also show an enhancement of the asymmetry toward the UP region (HD > 0) as predicted. B, Examples of rapid changes in two single units from FerDN. All figure conventions are the same as in 4A above. As predicted in Figure 2B, the STRFs adapted so as to enhance their sensitivity to the upward pitch shifts of the tone sequence on FerDN. Both neurons show an enhancement of the asymmetry at low and high densities, which is highlighted by the dashed circles for (LD > 0; HD < 0).

