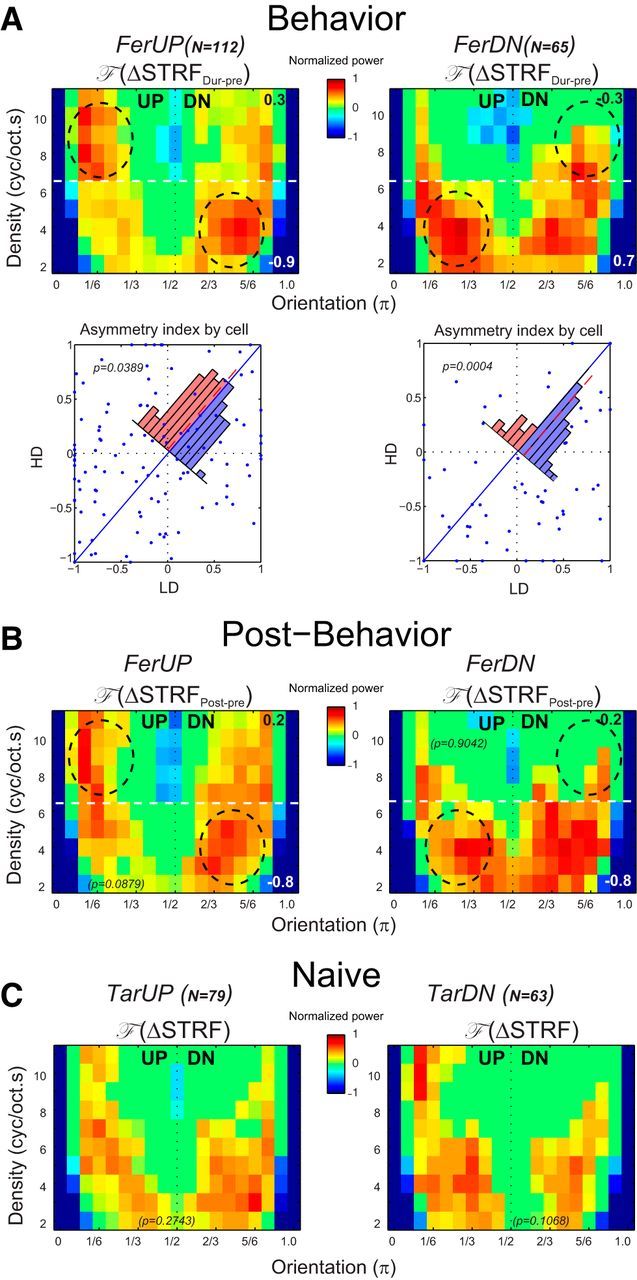
Figure 5.

Population STRF changes in different behavioral states. A, Averaged changes in the behaving animals. Top, Population averages of F (ΔSTRFDur-pre) from 112 units in FerUP (left) and 65 units in FerDN (right). The average is strongly asymmetric, reflecting enhanced sensitivity to DOWN shifts in FerUP, and UP shifts in FerDN, as highlighted by the dashed circles. Note the opposite asymmetry at LD and HD regions (the white dashed lines at 7 cycles/octave.s indicate the border line that divides the two regions) in both FerUP and FerDN. The asymmetry indices LD and HD are computed and are given in the bottom right and top right corners of all panels. LD versus HD asymmetry indices from all cells are shown in the scatter plot (bottom). Consistent with the matched filter hypothesis, the points tended to lie above the midline (LD − HD < 0) for FerUP (paired Wilcoxon signed rank test, p = 0.0389), and the opposite for FerDN (paired Wilcoxon signed rank test, p = 0.0004), as confirmed by the overlaid histograms of the differences. B, Averaged changes in passive post-behavior. The asymmetry of the average F (ΔSTRFPost-pre) at both LD and HD region persisted in FerUP (left), but not in FerDN (right) after the behavior. C, Averaged changes in the naive animals. Responses to the same sequence of tone sequence sounds in a behaviorally naive animal demonstrate that presenting the stimuli passively induces very weak changes, with no significant asymmetry in the population average (F (ΔSTRF)).
