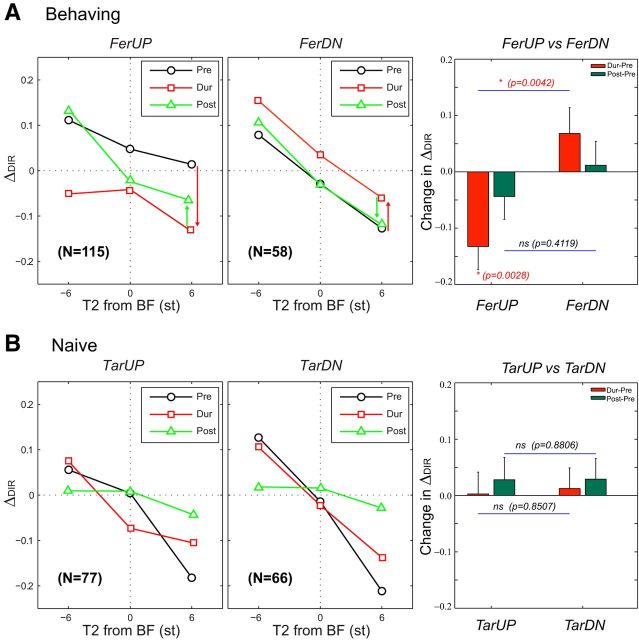
Figure 7.
Evidence of spectrotemporal plasticity in directionality functions. Rapid plasticity in responses to the tone pairs led to similar conclusions as those derived from analysis of STRF changes (based on responses to TORCs). A, Left, Middle, The directionality index function ΔDIR (ordinate) reports the directional selectivity of unit responses to upward or downward tone-pair shifts. The index varies with the frequency of the second tone (T2) relative to the BF of the cell (abscissa) (e.g., for T2 at 6 to −6 semitones [st] relative to the BF of each cell). During behavior, the average indices from all FerUP cells shift significantly toward negative values (red curve and arrow), indicating an enhanced preference to DN shifts. The opposite occurs in FerDN responses (red curve and arrow). Measurements from the same cells after behavior (green curves and arrows) indicate that the enhancement weakly persists in FerUP after conclusion of the task, but not in FerDN, as indicated by the green arrows in each panel. Right, Summary of average index changes in the two behaving animals. The red bars represent significant changes during behavior relative to measurements in the prepassive state. In all, these shifts are toward negative indices in FerUP and toward positive indices in FerDN (i.e., in the same direction of enhancements as those found in the STRF changes). *Statistical significance for the change of directional index during versus before task by Wilcoxon signed rank test, or of the difference of the changes between the animals (FerUP vs FerDN) by Wilcoxon rank sum test. B, Left, Middle, In the naive animal, there were no significant shifts during the three conditions. Right, The average index changes in the naive animal showed no significant changes in the indices across the population.

