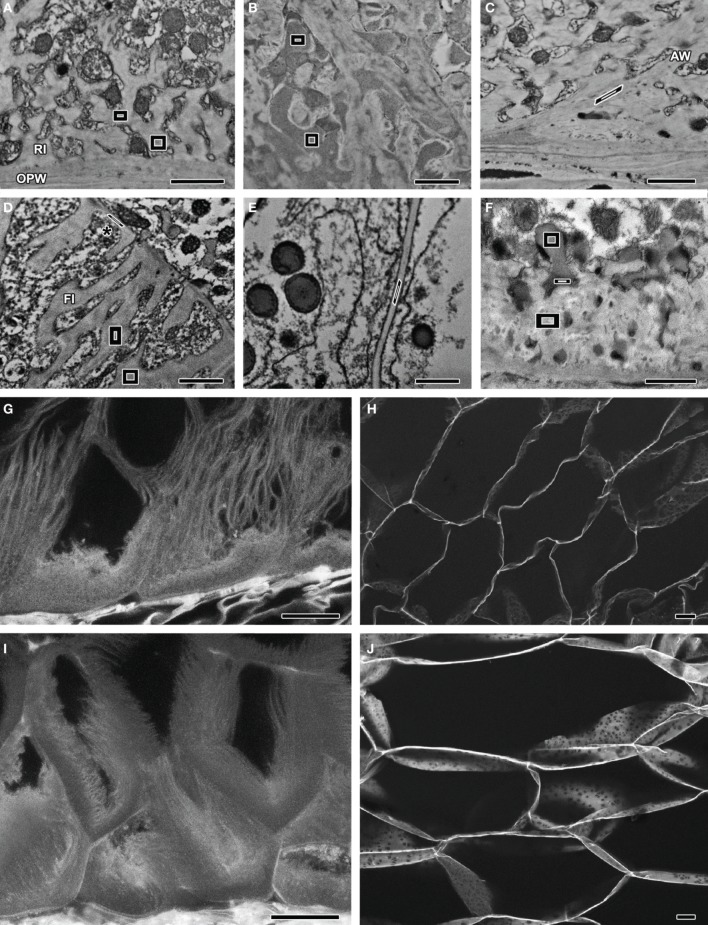
Figure 1.
Images obtained by TEM-EDS (A–E) and TEM (F) of samples stained with KMnO4. Polygons represent the boundaries of EDS readings in each sample. (G–J) CLSM images of acriflavine-stained samples. (A) MBETCs at 12 DAP – readings were obtained from the reticulate ingrowths. (B) MBETCs at 12 DAP – readings were obtained from vesicles adjacent to reticulate ingrowths. (C) MBETCs at 12 DAP – readings were obtained from anticlinal walls. (D) MBETCs at 20 DAP – readings were obtained from flange ingrowths and inner periclinal walls (*). (E) Starchy cells at 20 DAP – readings were obtained from the walls. (F) MBETCs at 6 DAP – readings were obtained from vesicles releasing their contents into reticulate ingrowths. (G) MBETCs at 9 DAP. (H) Starchy cells at 9 DAP. (I) MBETCs at 25 DAP. (J) Starchy cells at 25 DAP. AW, anticlinal wall; FI, flange ingrowth; OPW, outer periclinal wall; RI, reticulate ingrowth. Scale bars: (A–F) = 1 μm; (G–J) = 20 μm.

