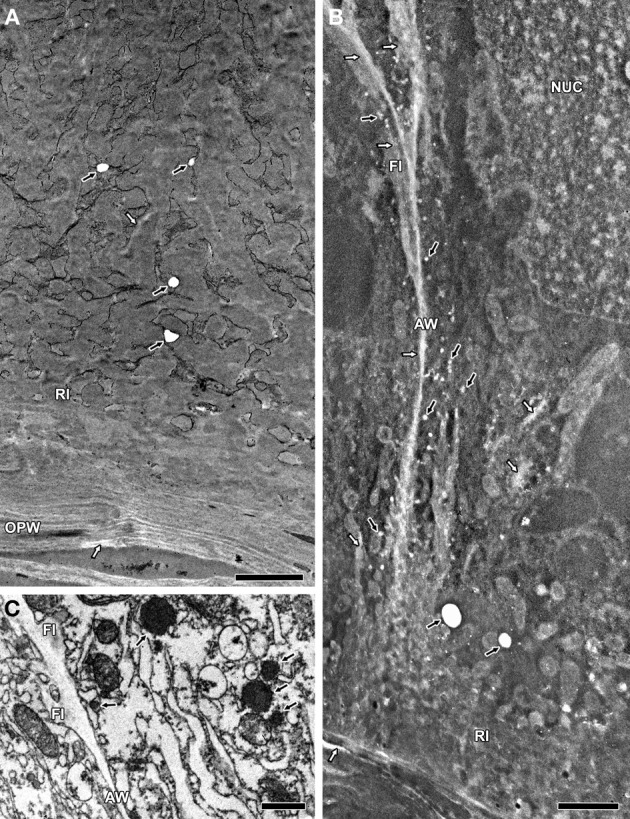
Figure 2.

TEM images of ultrathin MBETC sections at 10 DAP, after H2O2 treatment without contrast (A and B) and control sections at 6 DAP without treatment and contrast (C). (A) After a 15-min H2O2 treatment, some vesicles lacked electron density (black arrows), whereas reticulate ingrowths and the OPW show regions with less electron density (white arrows). (B) After a 60-min H2O2 treatment, many vesicles lost their electron density (black arrows), whereas reticulate and flange ingrowths, the OPW and anticlinal walls reveal large regions with less electron density (white arrows). (C) Control sections with electron-dense vesicles (black arrows), whereas the walls and flange ingrowths have a weak electron density. AW, anticlinal wall; FI, flange ingrowth; NUC, nucleus; OPW, outer periclinal wall; RI, reticulate ingrowth. Scale bars: (A,B) = 2 μm, (C) = 1 μm.
