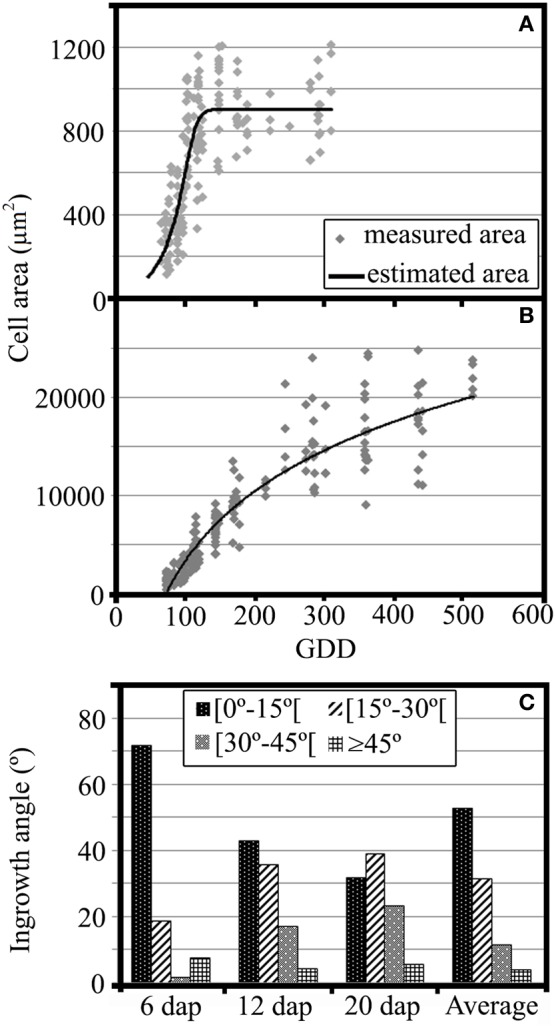
Figure 3.

(A) Growth analysis of MBETCs, showing cell areas (μm2) of developing kernels (4–20 DAP, equivalent to 62.0–300.2 GDD) and adjusted growth curve (cell area = 903.04/(1 + exp(15.81 − 0.15 × GDD)∧(1/4.37)), R2 = 67.15%). (B) Growth analysis of starchy cells, showing cell areas (μm2) of developing kernels (5–35 DAP, equivalent to 73.5–522.0 GDD) and adjusted growth curve (cell area = −43582.6 + 10195.3 × ln(GDD), R2 = 92.3%). (C) Flange ingrowth angles (in relation to the nearest anticlinal wall) of developing MBETCs (6, 12, and 20 DAP, and an average of the three sampling dates).
