
Figure 9.
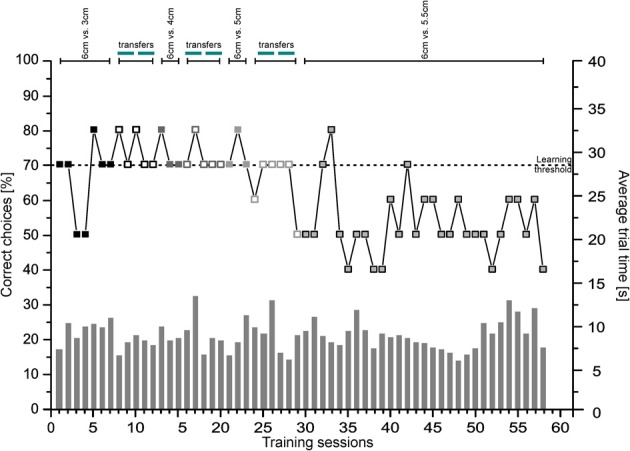
Size pairs. Shown is the performance of Shark 3 as the percentage of correct choices per session (symbolized by boxes; left ordinate) as well as the average trial time (s) per session (symbolized by gray bars; right ordinate) per phase until the learning criterion was reached.