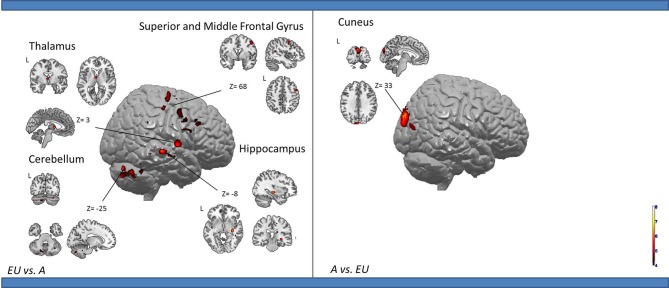
Figure 2.
Shows regions reported in Table 3 projected onto 3D anatomical template (random-effect analysis, statistical threshold: uncorrected p < 0.001, cluster extent: k ≥ 10 voxels). Activations are provided by a random effect analysis, for (1) EU spatial encoding when contrasted with the A condition (on the left), and (2) A spatial encoding when contrasted with EU (on the right). Clusters are projected on 2D anatomical slices (T1-template image) in neurological convention. L is left hemisphere. The color scale represents the t-value of activation.

