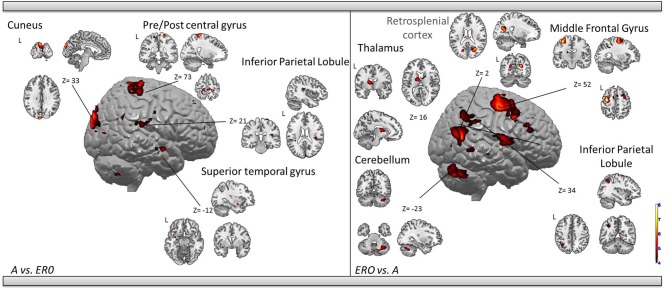
Figure 4.
Shows regions reported in Table 3 projected onto a 3D anatomical template (random-effect analysis, statistical threshold: uncorrected p < 0.001, cluster extent: k ≥ 10 voxels). Activations are provided by a random effect analysis, for the A spatial encoding when contrasted (1) with the EU condition (on the left), and (2) with the ERO condition (on the right). Occipital activity in the cuneus which is observed in both contrasts is highlighted. These clusters are projected onto 2D anatomical slices (T1-template image) in neurological convention. L is left hemisphere. The color scale represents the t-value of activation.

