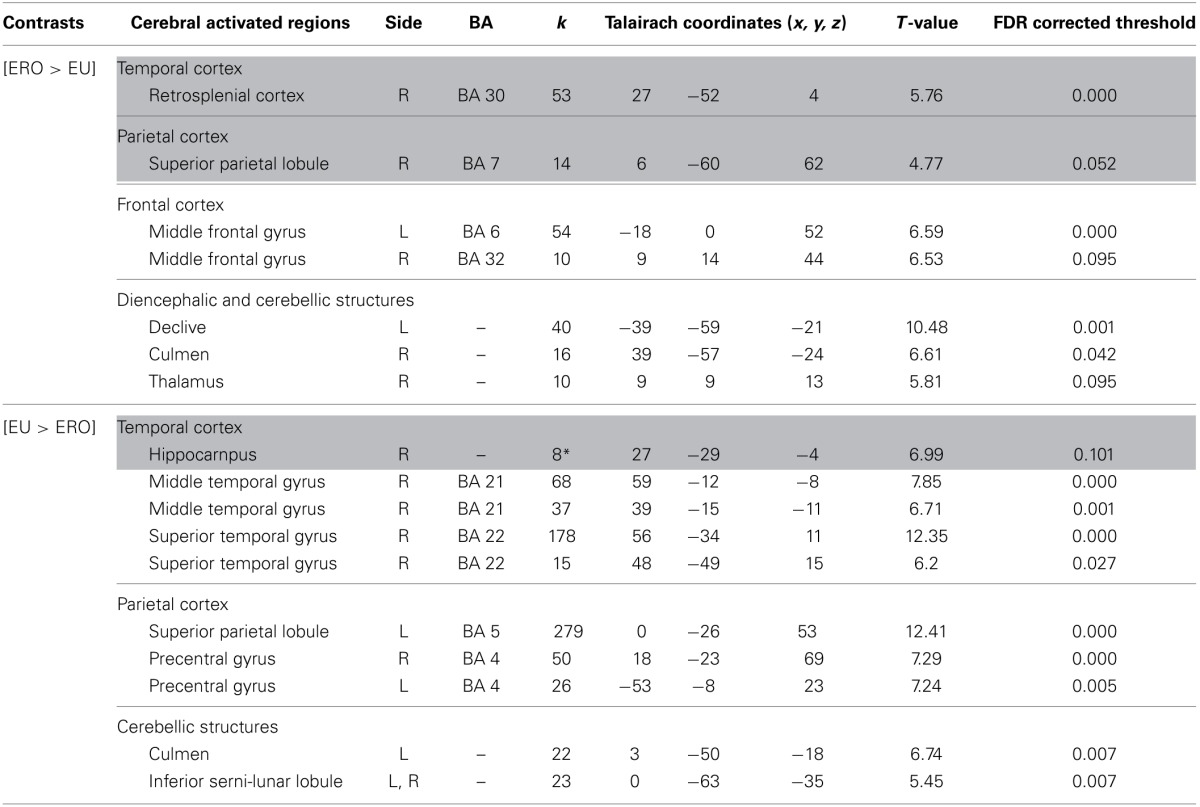
Table 4.
Activated regions for differential effects within two types of Egocentric spatial encoding, rotation changes vs. orientation and location changes.

They were provided by the contrast: (1) ERO vs. EU for the upper part of the table. (2) EU vs. ERO for the lower part of the table (random-effect analysis, uncorrected p < 0.001, k ≥ 10 voxels, * for the hippocampus k = 8). The Talairach coordinates (x, y, z) are indicated for each voxel. The side, Right (R) and Left (L), gyri and Brodmann areas (BA) are mentioned. FDR corrected threshold provides corrected values detailing the prevalence of false positives in the analysis.
