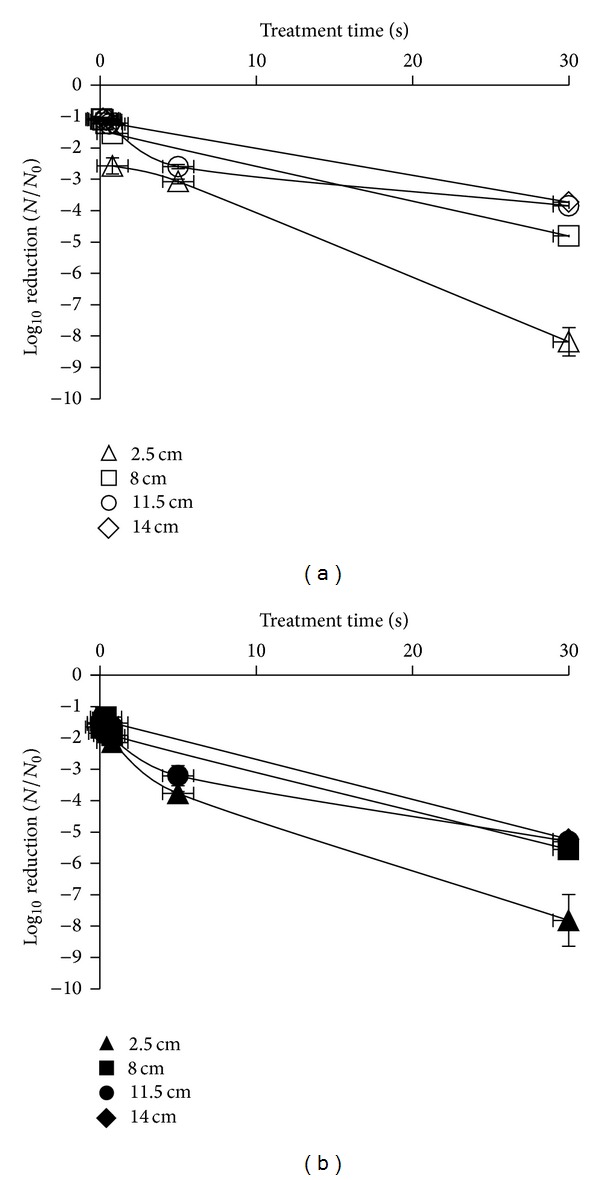
Figure 3.

Survival curves of E. coli suspended in maximum recovery diluent (MRD) placed at 2.5 cm (∆), 8 cm (□), 11.5 cm (○), and 14 cm (◊) and L. innocua placed at 2.5 cm (▲), 8 cm (■), 11.5 cm (●), and 14 cm (♦) from HILP source (results expressed as mean log10 CFU/mL).
