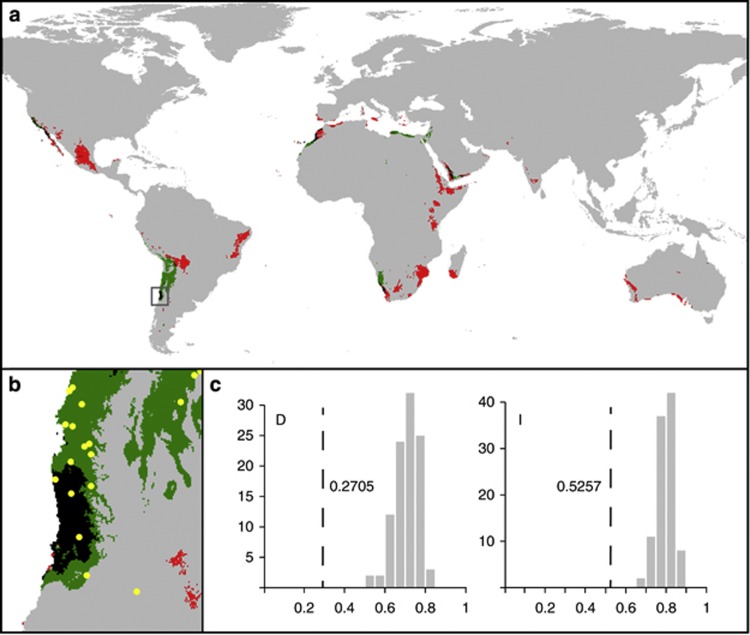
Figure 3.
Environmental Niche Models. (a): Predictive ecological models based on the Maxent algorithm. Probabilities of presence >0.5 are represented for ribotype groups A (green) and B (red). Overlapping areas are shown in black. (b): Close-up of overlapping niche areas in South America. Yellow dots denote localities where specimens from ribotype group A were found. (c): Niche comparisons of ribotype groups A and B based on D and I as measures of niche overlap. Dotted lines represent niche overlap measures of the original data, and bars show the expected degree of niche overlap when samples are drawn from the same distribution (i.e., pooled samples of occurrence points from the ribotype groups).

